
Good day everybody,
Welcome to CryptoGod-1's blog on all things crypto. Today I will be continuing my series on Chart Patterns, which is an area all traders should ensure to familiarise themselves with. In this entry I will be focusing on the Morning / Evening Star.
The Morning / Evening Star
The Morning and Evening Star patterns are used to signify price reversals in the market, with the morning star indicating a reversal into an uptrend, and an evening star indicating a reversal into a downtrend. Both appear in similar fashion, although as the opposite of each other. The morning star is found at the bottom of a downtrend, while the evening star is found the top of an uptrend.
Both these patterns are considered as reliable patterns by traders, while both of these patterns are made up of three candles each. The Morning Star is considered as a positive indicator, whereas Evening Star denotes a negative turnaround.
How to Recognize the Morning / Evening Star
The two types of candles are defined as follows;
Evening Star
This pattern represents an upcoming trend reversal when the price is at the top of a price uptrend. It is a bearish reversal of the trend, and consists of three candles:
a large bullish candlestick
a small-bodied candle
a bearish candle.
The Evening Star appears at the top of a price trend and is significant in its ability to predict the impending end of the trend. To identify the Evening Star candle, a trader need to look out for the following:
- Three candlesticks in a pattern, where the middle candlestick acts as the star.
- The first candle is continuing with the existing uptrend and closing higher than it opens, along with having a large body.
- The second and middle candle will be a Doji, meaning it will close close to where it opens and has a short body. This is the star, and it may have an upper and lower shadow but will close as a Doji or Spinning Top.
- This middle candle or star is the first indication of weakness, as the momentum slowed and the buyer were unable to continue pushing the price upwards.
- The third candle confirms the weakness, as it will be a red/dark candle which close far down the body of the first candle, meaning the price closes below the star candle.
This shows the bearish reversal is happening, and while the following candle after the third may gain a bit more upwards momentum, a downward breakout is expected.

Morning Star
This pattern represents an upcoming trend reversal when the price is at the bottom of a price downtrend, and is the opposite of the Evening Star. It also consists of three candles:
a large bearish candlestick
a small-bodied candle
a bullish candle.
The Morning Star appears at the bottom of a price trend and is significant in its ability to predict the impending end of the trend. To identify the Morning Star candle, a trader need to look out for the following:
- Three candlesticks in a pattern, where the middle candlestick acts as the star.
- The first candle is continuing with the existing downtrend and closing lower than it opens, along with having a large body.
- The second and middle candle will be a Doji, meaning it will close close to where it opens and has a short body. This is the star, and it may have an upper and lower shadow but will close as a Doji or Spinning Top.
- This middle candle or star is the first indication of strength, as the momentum slowed and the sellers were unable to continue pushing the price downwards.
- The third candle confirms the weakness, as it will be a green/light candle which close far up the body of the first candle, meaning the price closes above the star candle.
This shows the bullish reversal is happening, and while the following candle after the third may gain a bit more downwards momentum, an upward breakout is expected.

How to Trade the Morning / Evening Star
The Evening and Morning Star patterns do no occur as frequently as single pattern candle formations and therefore a trader must be vigilant and on the look out for them. Also it is important to verify all four conditions of the patten before entering into a trade, as only two or less candles will not fulfil the requirements of the patterns presence. Those four elements are:
Strong Existing Trend
Large Candle in Trend Direction
Small Doji Style Candle
Large Candle in Reverse Direction
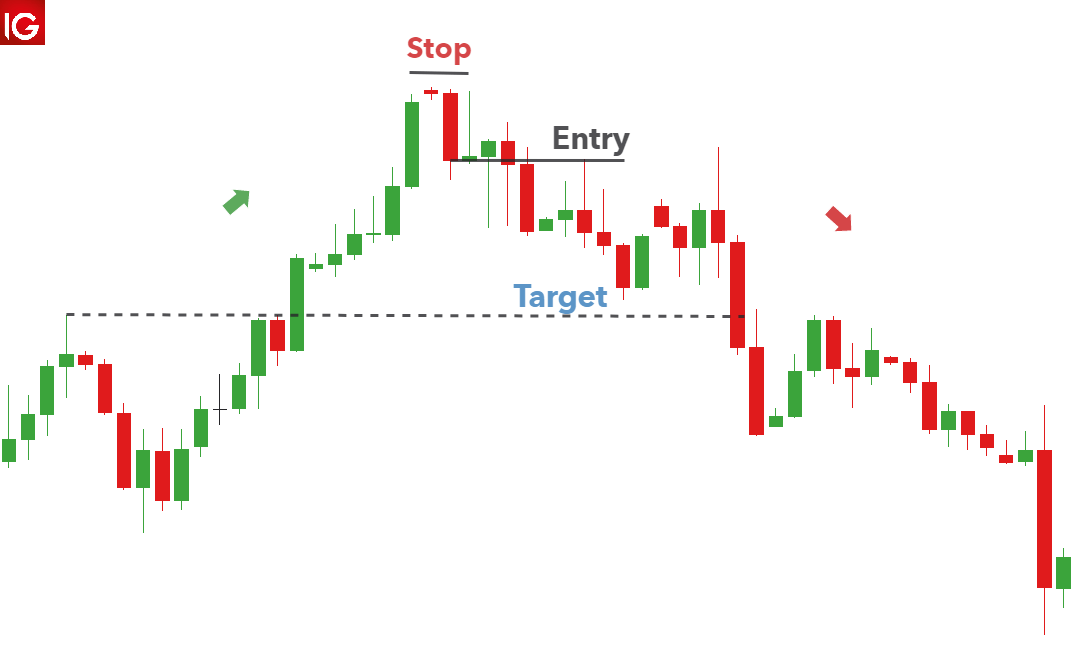
Once all four elements are present, then a trader should consider opening a trade. In the example below, an Evening Star has appeared in the chart. This example would work the same (albeit in reverse) for a Morning Star.
There is a strong bullish trend taking place, but the Evening Star pattern appeared when a Doji formed after a strong upwards candle, and was followed by a strong downwards candle.
The fourth candle begins to move upwards, which can be off-putting for opening a trade, but the pattern has been formed and the upwards momentum does not push past the previous Doji. A trader would/should have opened their trade after the pattern was formed, and placed their stop-loss above the location of the Doji.
As the candles following the pattern form, it is clear the previous momentum is lost, and the candles begin to push downwards. The target price is optional at whatever value of return the investor is looking for, but as shown below, it is often good to place it at a previous level of support / resistance.
Risks of Using the Morning / Evening Star
Both of the Morning and Evening Star patterns are useful indicators, but neither are exempt from mistakes. When using them as part of analysis, traders should be aware that these patterns do not work in all market conditions. For example, in highly volatile markets where no overall trend has be identified, these patterns will have much less significance if formed.
Morning stars are very rare in periods of a bull run, as generally the candles are consistently trending in an upwards direction. While they may appear in shorter time frames, it is much less likely in the larger time frame of the daily charts. The same can be said of an Evening Star during a bear market.
Finally, a false pattern is capable of appearing for the Evening and Morning Stars. To ensure that a trade does not get caught out by the false appearance of one of these patterns, a trader should ensure they make use of other technical analysis alongside the candlestick pattern to ensure the momentum is changing and a reversal is about to take place.
Conclusion on the Morning / Evening Star
The Morning and Evening Star candlestick patterns are excellent indicators of trend reversals in the markets. They can be used to identify both buying and selling opportunities, along with an appropriate level for placing a stop loss to minimise any loses in case of a false pattern forming. The patten is made of three candles, the first a continuation of the existing strong momentum. The second is a Doji candle, with the third candle showing a reversal of the trend and confirming the pattern. Traders can use this pattern to confirm a reversal is about to take place and open a trade, but they should always ensure that other indicators are in use to ensure they are correct with the pattern. It is also a difficult and rare pattern to spot, but can be particularily useful on the daily chart to show a large change in momentum.
You can find the previous parts to the series here:
Chart Pattern - Part I - Understanding Candles
Chart Pattern - Part II - Doji
Chart Pattern - Part III - Marubozu
Chart Pattern - Part IV - Hammer / Hanging Man / Shooting Star
Chart Pattern - Part V - Spinning Top
Chart Pattern - Part VI - Engulfing
Chart Pattern - Part VII - Harmai
If you would like to check out the previous series I did, which focused on Technical Analysis, you can find it here: Recap of the Technical Analysis Series - Parts I - XXV
Have a great day.
Peace. CryptoGod-1.
Referral Links and Follow Me:






