
Good day everybody,
Welcome to CryptoGod-1's blog on all things crypto. Today I will be continuing my series on Chart Patterns, which is an area all traders should ensure to familiarise themselves with. In this entry I will be focusing on the Doji.
The Doji Candlestick
A Doji (dо̄ji) is a name given to a transitional candlestick pattern, which happens in a trading session when the open and close levels that are virtually equal, meaning there was equality or indecision between bulls and bears. It looks like a cross as the opening and closing prices are equal or almost the same, and can often be found at the bottom and top of trends. Often traders consider the Doji a sign that a possible reversal of price direction could be about to take place, although in reality the Doji can also be viewed as a continuation pattern.
It is important to emphasize that the Doji pattern does not mean reversal, in fact its actual meaning is indecision. As Doji candlesticks are often found during periods of rest after a significant move higher or lower, once the market has rested, then it continues on its way. However, a Doji pattern could also be interpreted as a sign that a prior trend is losing its strength, and taking some profits might be a considerable choice to make at this time.
How to Recognise a Doji Candlestick
As mentioned above, the Doji candlestick generally forms when bullish and bearish traders are equal. This can happen in a multitude of ways, but the most common are often when:
- Bullish traders push the price up from the opening price, then bearish traders attempt to reject the higher price and drive it down, before the bulls push it back up to its original opening price.
- Bearish traders push the price down from the opening price, then bullish traders attempt to reject the lower price and drive it up, before the bears push it back down to its original opening price.
The upward and downward movements that happen during the set period between open and close form the wick of the candle, with the differences in the opening and closing price of an asset reflected in the body of the Doji candle. The top wick shows the highest price and the bottom represents the low.
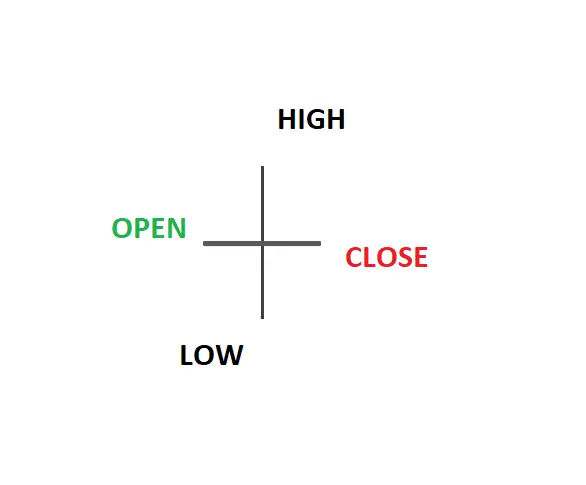
This creates a cross shape as the price open and close price of the asset is basically at the same level. The cross shape forms in a way where the candle’s body will either be very small or almost non-existent, while the upper and the lower wicks are often at an equal length.
Below is an image from dailyfx.com showing a basic Doji Candlestick with equal length wicks at top and bottom, and an almost flat body.
Types of Doji Candlestick
There are multiple variants of the Doji that form in the candlestick chart, with each bringing their own significant meaning to how a trader should interpret them:
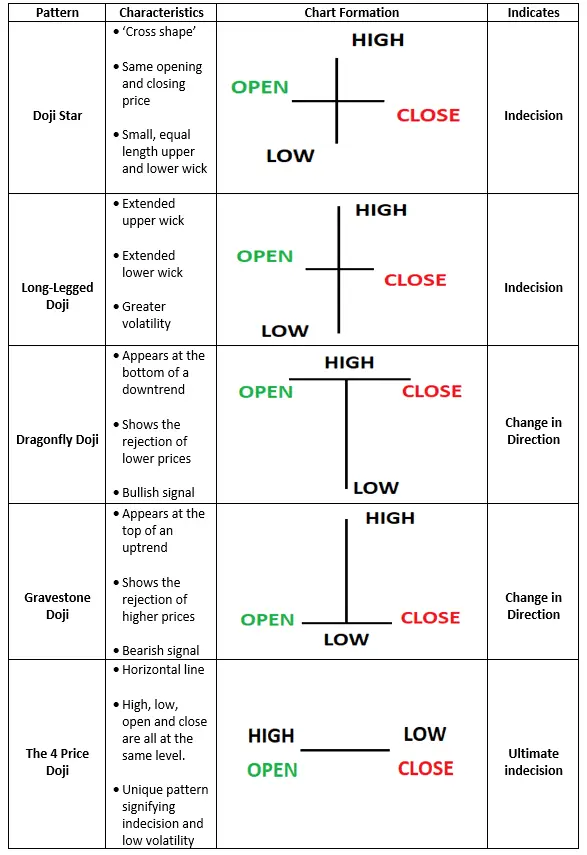
Doji Star – On of the most common and basic Doji candlesticks, the Doji Star looks just like a star with its opening and closing prices at the same value. The wicks at the top and bottom are also equal in length, although they are not that long and this indicates that neither the bulls nor the bears could get strong enough momentum to sway the market.
Long-legged Doji – Very similar to the Doji Star, this is when the star has extended upper and lower wicks. This shows that there was even greater movement in price between opening and close, and that the indecisiveness is greater with a larger amount of volatility.
Dragonfly Doji – This is a Doji which is generally found at the bottom of a downtrend. It signifies that the lower price has been rejects, and unlike the Doji Star or Long-Legged Doji, the dragonfly does not signify market indecision. Instead it signals a possible and likely trend reversal, with prices expected to go upwards. Its appearance is that of having no real body, no upper wick, and a long trailing lower wick. Therefore it results in a T-shaped candle.
Gravestone Doji – The opposite of the Dragonfly Doji, the Gravestone Doji appears at the top of an uptrending market. It shows the markets rejection of higher prices, with the candle itself being the inverse of the Dragonfly. It has no lower wick, a very non existent body, and a long trailing upper shadow. Therefore it results in an inverted ‘T’.
4-price Doji – This is one of the more interesting Doji Candles. It is the ultimate visual for indecision in the market, as the candle is a pure horizontal line with no wicks. The pattern appears when the open, close, high, and low are all the same.
Below is a chart from dailyfx.com showing how the above Doji candlesticks look when on a chart, along with what they indicate for a trader.
How to Trade a Doji Candlestick
Many traders make use of interpreting the Doji Candlestick to confirm the indecision in the market, or the preparation of a trend reversal. This can be taken as a moment to ‘pause and reflect’ while waiting for more convincing patterns to emerge. It is important to reflect on the overall market, as a Doji candlestick appearing during an uptrend may imply that buying momentum is slowing down, but it may also be momentary indecision before the market continues to move in the same direction. Therefore it is not recommended to trade on a single Doji pattern alone, as it may be wrong, and traders should make use of additional analysis and indicators to confirm the signals.
Neutral Doji
When a Star Doji appears on the chart, it is important for a trader to reflect and make use of other analysis. If it appears during a newly formed uptrend, will the upward movement continue? To be more accurate in predicting this, a trader should make use of TA such as the MACD for RSI. These can help to indicate if the momentum is indeed slowing down, and whether or not the asset is considered overbought or has more room for growth. Another important analysis to note is the support and resistance levels. These can be very indicative of whether or not a reversal is expected or if the trend will continue, as a Doji at these levels could coincide with a reversal. Overall the best way to trade a Doji Candle is to wait for the next candlestick to break above the Doji's high or low. Check the indicators, and then make a decision on whether to open (or close) a trade.
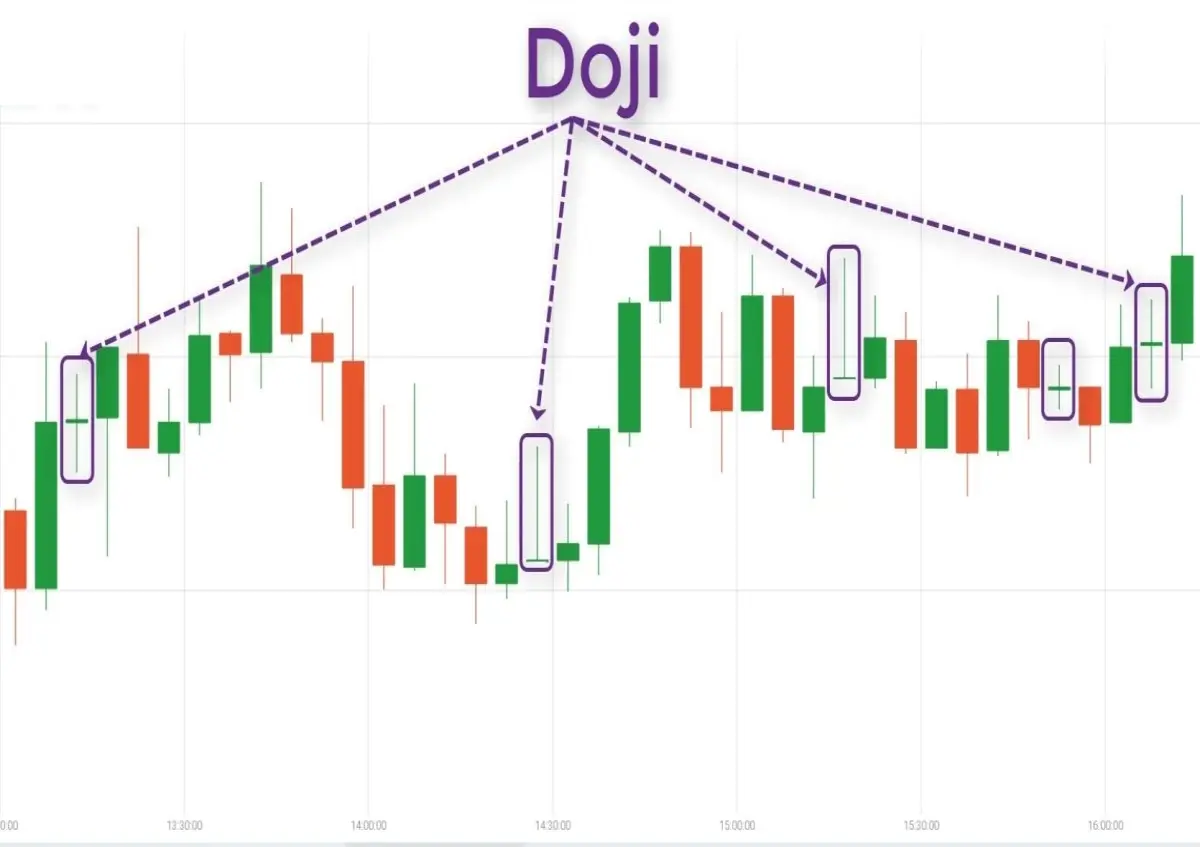
The below image from howtotradeblog.com is depicting Doji Stars and Long-Legged Doji's.
Dragonfly and Gravestone Doji
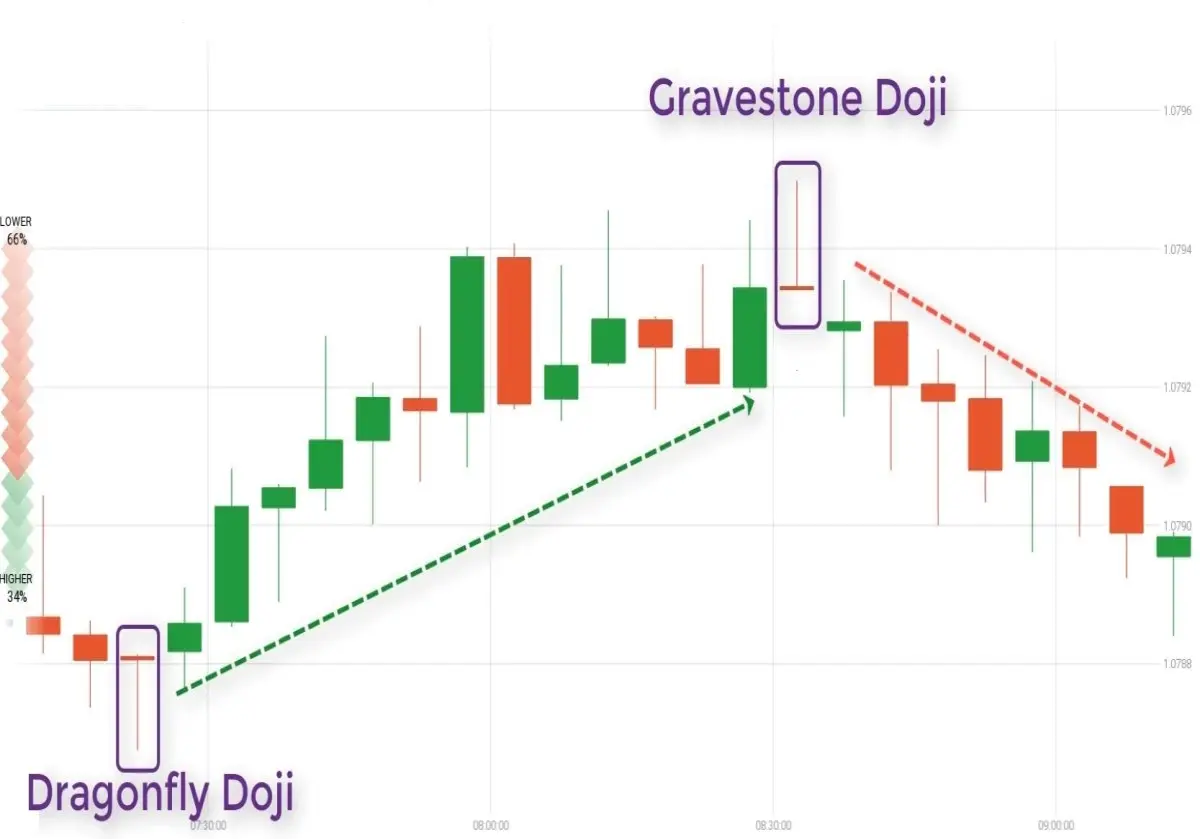
When looking for Dragonfly and Gravestone Dojis, which can provide signals independently, it is important to look for additional technical indicators. When the Dragonfly Doji appears after a steep bearish decline, it indicates an upwards trend reversal. When the price action has been climbing higher for a period of time before a Gravestone Doji appears, it indicates a downwards trend reversal. It is important to wait for the Doji to complete and see what direction the next candle following it takes. A trader should also refer to the Stochastic to see if the asset is considered oversold or overbought. A popular strategy for these types of Doji's is to look for them to appear near levels of support and resistance.
The below image from howtotradeblog.com is depicting a Dragonfly Doji and a Gravestone Doji
Double Doji
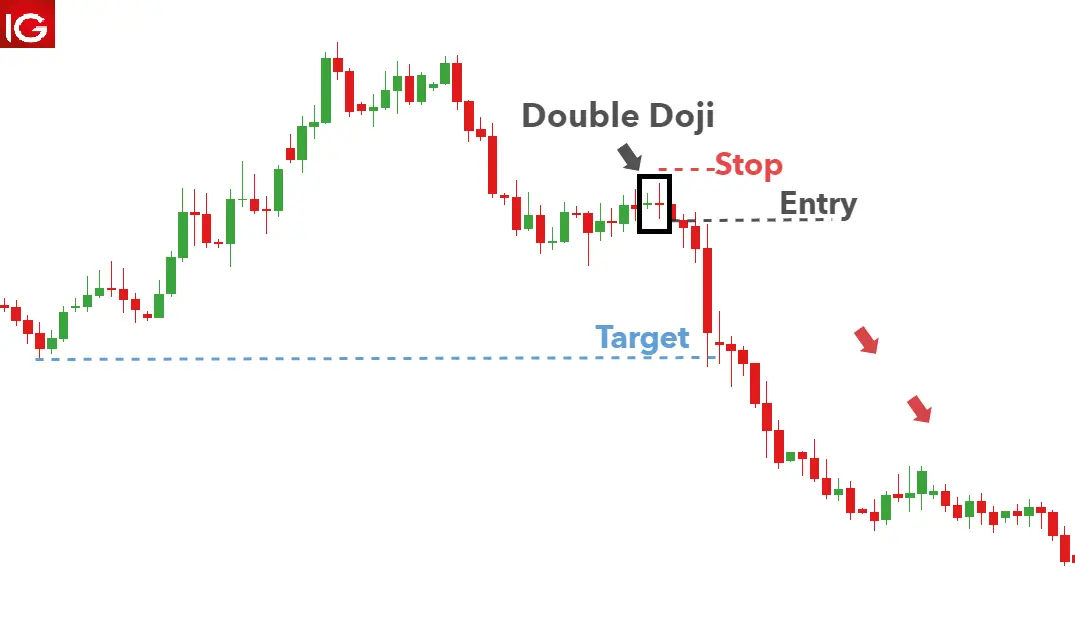
While an individual Doji is considered a good indication of indecision in the market, having two Doji's appear one after the other is an even greater indication that often ends up with a strong breakout. The Double Doji strategy therefore looks to take advantage of the strong directional move that unfolds after the period of indecision. Traders often wait until the first candle after the double Doji to see which direction the market is breakout towards. The entry point can be below the low of the two Doji's with a stop loss placed above the high, or an entry point placed above the high of the two Doji's and the stop loss below the low. Targets should then be placed at recent levels of support or resistance, although breakouts with strong momentum can often run for an extended period of time and go beyond the previous support and resistance levels. Therefore it is often good sense to apply a trailing stop.
The below image from dailyfx.com is depicting a Double Doji
Risks of using a Doji Candlestick
It is not wise to using a Doji as a standalone signal, as this candle is typically neutral in most cases. On top of that, a trader risks missing crucial information before making a trade if they soley rely on a Doji, as this candlestick pattern only relates to the price information.
It is also important to note that Doji Candles do not appear frequently, and even when they do appear, they need to be combined with other forms of technical analysis and indicators to get the most accurate signals.
As the Doji is sometimes used as an informant towards a price reversal, it is important to note that even if the price does reverse, there is no guarantee how reliable or for how long it will last. There is also no assurance that the price will continue in the expected direction following the confirmation candle.
A trader can take not of the length of a Doji's wick, which when coupled with the size of the confirmation candle, can sometimes indicate that the entry point will end up being a long way from the stop loss point. Due to this, it is advised for traders to revise their stop loss location if this is the case, or may need to forgo the trade overall.
Estimating the potential reward of a Doji-informed trade also can be difficult because candlestick patterns don’t generally provide price targets. Other techniques, such as other candlestick patterns, indicators, or strategies, are required to exit the trade, when and if they are profitable.
Conclusion on Doji Candlestick
All in all, the Doji Candlestick pattern is not the best pattern for providing strong buy and sell signals, however it does give traders a good insight into moments of indecision among the bullish and bearish traders. This does highlight potential opportunities and gives traders an insight of moments where they should be reflecting and consulting other forms of analysis.
It is more suitable for intermediate and professional crypto traders since they can easily spot them and interpret their signals.
Things traders some remember of important when trading with a Doji candle are:
- A Doji candlestick appears at a lonely peak. It means there are gaps before and after it, indicating it is a potential sign of a reversal with high precision.
- If the bullish Doji candles in sequence appear to be gradually shorter, it signals that the bullish force is weakening. The probability of price reversal in this moment is very high. Conversely, if bearish Doji candles in sequence appear to be gradually shorter, the bearish force might have been eliminated or be weakening. The reversal is likely to happen.
You can find the previous parts to the series here:
Chart Pattern - Part I - Understanding Candles
If you would like to check out the previous series I did, which focused on Technical Analysis, you can find it here: Recap of the Technical Analysis Series - Parts I - XXV
Have a great day.
Peace. CryptoGod-1.
Referral links:
Publish0x - https://www.publish0x.com/?a=olejZqrzej
Splinterlands - https://splinterlands.com?ref=rnabc1
Upland - r.upland.me/NQAH
Binance - https://accounts.binance.com/en/register?ref=143611368
NFT Market Sales
Opensea - https://opensea.io/RNabc
Follow Me :)
Twitter - @RNabc123






