
Good day everybody,
Welcome to CryptoGod-1's blog on all things crypto. Today I will be continuing my series on Chart Patterns, which is an area all traders should ensure to familiarise themselves with. In this entry I will be focusing on the Hammer / Hanging Man / Shooting Star patterns. The three of these patterns are similar in how they look on a chart, although each brings with it a different meaning and understand towards the sentiment of the market.
The Hammer / Hanging Man / Shooting Star Candles
These patterns are all similar in nature and can often be mistaken for each other, hence why I complied them all into the one post. Considered some of the most popular candles for traders all around the world. The Hammer and the Shooting Star both candles have the same shape with small bodies and long shadows, which are often required to be two to three times the height of the candles body. The Hammer is found at the bottom of a trading session whereas the Shooting Star is found at the top of a trading session. The Hanging Man is also found close to the top of a trading session, but unlike a Shooting Star, it is found without a long top shadow. Generally it is taken that the longer the tail is on the Hammer or Shooting Star, the more meaningful the pattern is.
The Hammer and the Shooting Star can be taken as reversal signals due to the strength being shown with them in the market, however, the Hanging Man requires a confirmation as the market has not shown to have proved its abandonment in the existing trend with this candle. It is good practice to wait for a confirmation for all three patterns, and this confirmation should be a long and full bullish candle for the Hammer, while a long and full bearish candle will suffice for the Shooting Star and Hanging Man. Volume also needs to be considered when looking at confirmation candles.
It is also important to note that these patterns can just be a signal that the current trend is ending and that the market may move sideways, or they could be a signal that a real reversal is about to happen.
How to Recognize the Hammer / Hanging Man / Shooting Star Candles
The Hammer
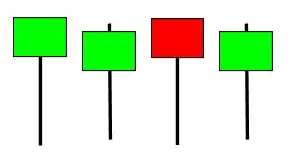
The Hammer is recognisable by the fact it has a small body and a long lower shadow (generally two to three times the size of the candles body) and is found near the bottom of the trading session during a bearish trend. Generally there is a small or non existent upper shadow. The body of the candle can be either green or red (black or white) as this does not impact the signal of the pattern, although some consider a green body to be an additional confirmation within the pattern. The Hammer appears at the end of a bearish trend and the long lower shadow is due to the buying pressure which is likely to drive a reversal. Often it is stated that if the opening price in the next pattern is higher than the closing price in the Hammer, the bullish trend reversal has been confirmed, although many like to wait for a long bullish candle to fully confirm the reversal.
The below image from smartmoney shows what a Hammer Candlestick Pattern looks like. Note all four candles shown are types of Hammer.
The Inverted Hammer
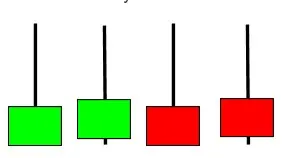
The Inverted Hammer is basically the Hammer Candlestick but in an inverted form. The body is once again small is size and it appears at the lower end of a trading session. It generally has a long upper shadow with a small or no lower shadow. The upper shadow should be two or three times the size of the candles body. This pattern appears where there is a possibility of a reversal from a bearish to a bullish trend, and the colour of the candle is not of importance. It always follows a bearish candle, although the overall trend does not need to be bearish. The longer the upper shadow, the strong the bulls influence is due to an increased pressure to drive prices back up, although it is unsuccessful and the price is driven back down to form the small body. With the increased pressure the market is signalling the end of the downtrend and a reversal is about to take place. Often a trader will wait for the following candle to open and close above the closing price of the Inverted Hammer to confirm the reversal in trend.
The below image from smartmoney shows what an Inverted Hammer Candlestick Pattern looks like. Note all four candles shown are types of Inverted Hammer.
Hanging Man
For a trader to spot the Hanging Man on a chart, they must recognise that it is very similar to the Hammer in that the body of the candle is short and appears on the upper end of the trading session. In order to be a Hanging Man, it must have a very short upper shadow or no upper shadow at all. The lower shadow should be two or three times the size of the candles body. This pattern appears where there is a possibility of a reversal from a bullish to a bearish trend, and the colour of the candle is not of importance. It always follows a bullish candle, although the overall trend does not need to be bullish, just the candle prior to the Hanging Man. It is also noted that the longer the lower shadow, the stronger the bears influence is, as the long lower shadow signifies that the bears are trying to take control of the price movement.
The below image from smartmoney shows what a Hanging Man Candlestick Pattern looks like. Note all four candles shown are types of Hanging Man.
Shooting Star
Similar to the Hammer candle, a Shooting Star is noted by its small body and long upper shadow, usually two to three times or more the size of the candles body, near to the top of the trading session in a bullish trend. Generally there is a small or non existent lower shadow. The body of the candle can be either green or red (black or white) as this does not impact the signal of the pattern, although some consider a red body to be an additional confirmation within the pattern. The Shooting Star appears at the end of a bullish trend and the long upper shadow is due to the selling pressure which is likely to drive a reversal. Often it is stated that if the opening price in the next pattern is lower than the closing price in the shooting star, the bearish trend reversal has been confirmed, although many like to wait for a long bearish candle to fully confirm the reversal.
The below image from smartmoney shows what a Shooting Star Candlestick Pattern looks like. Note all four candles shown are types of Shooting Star.
How to Trade the Hammer / Hanging Man / Shooting Star Candles
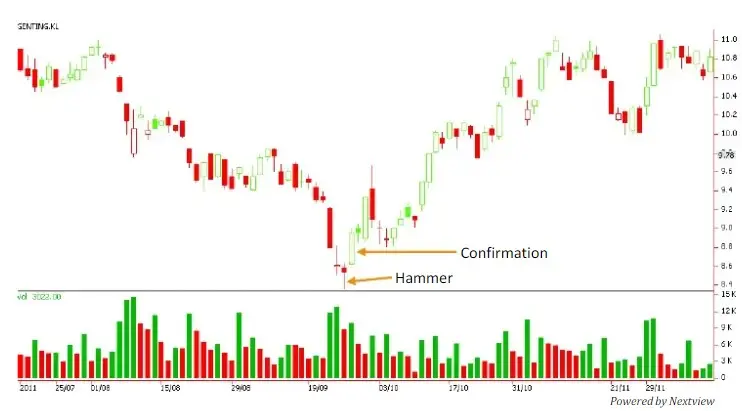
As noted above, the Hammer and the Inverted Hammer appear towards the end of a bearish trend and signals a reversal to a bullish trend. For a trader to trade one of these signals, it is important to ensure there is a confirmation signal. The confirmation signal in this scenario is a long full bodied candle which opens and closes above the closing price of the Hammer or the Inverted Hammer. Its a bullish candle and confirms that the price is rising as the bulls are taking control. A Hammer and the Inverted Hammer can also be used as a confirmation when two appear together as they give a stronger strength to the signal of the downtrend ending. Volume is important to consider, as the strong volume indicates the buying pressure being applied by the bulls as the bears struggle to keep the price down.
The image below from academia shows the Hammer pattern along with a confirmation. The same could be applied for an Inverted Hammer.
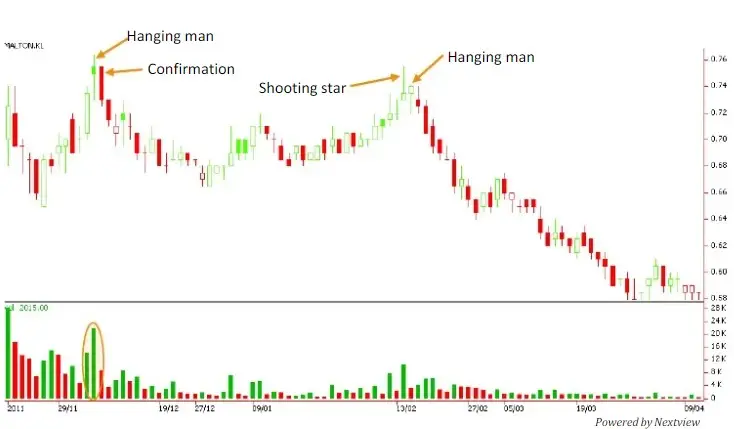
The Shooting Star and the Hanging Man appear at the top of a trading session and signal a reversal to a bearish trend. For a trader to trade one of these signals, it is important to ensure there is a confirmation signal. The confirmation signal in this instance is taken as a long full bodied candle which opens and closes below the closing price of the Shooting Star or the Hanging Man. It is a bearish candle and confirms that the price is dropping as the bears are taking control. A Shooting Star or Hanging Man may also be used as a confirmation when the two appear together to give an even stronger indication of the end of the uptrend. Volume is also important to consider, as the strong volume showed the struggle for the bulls to remain in control as the bears persisted.
The image below from academia shows the Hanging Man / Shooting Star patterns along with a confirmation.
Risks of Using the Hammer / Hanging Man / Shooting Star Candles
A lot of trading is based on emotion, and when trading with the Hammer, Hanging Man, or Shooting Star candles it is no different, For example if people who bought an asset at a specific price which it fall lower and lower in price, once the price hits a specific low level more people will buy in, thus pushing the price back up. This is how a hammer can be formed for example, and it is important for a trader to distinguish their emotions when trading. All of the candles mentioned are based off a change in buying or selling pressure from the bears and bulls. It is important to watch the volume along with the candles when trading with these patterns, as high levels of volume can be used to confirm the pattern along with a confirmation candle as mentioned above. Traders can get caught out with these patterns when they do not result in an immediate reversal, instead the price may just move sideways. Another way of getting caught out is when the shadow is not meeting the criteria of a minimum of twice the size of the candles body. These can lead to false signals and trades which may not go as expected. Also it is important to note if the market is in a strong trend then these candles can be more accurate in signalling a reversal in the current trend compared to a ranging market.
Conclusion on the Hammer / Hanging Man / Shooting Star Candles
The Hammer, Hanging Man, and Shooting Star candles are very common patterns which can be used by traders to signal a reversal in a trend. They appear at the top or bottom of a trading range and are especially obvious due to their long shadow and small body. The candle signals a reversal in trend when it is confirmed, which can be done by analysing the volume of the candle and a following confirmation candle pushing the new trend direction. It is important for traders to wait for the confirmation candle to be certain of the signal, as it is possible that one of these candles will signal the end of the existing trend before the price begins to move sideways. As always, this pattern is visible on a variety of trading timeframe and it can be quite useful to check for the candle pattern on a higher timeframe before entering a trade.
You can find the previous parts to the series here:
Chart Pattern - Part I - Understanding Candles
Chart Pattern - Part II - Doji
Chart Pattern - Part III - Marubozu
If you would like to check out the previous series I did, which focused on Technical Analysis, you can find it here: Recap of the Technical Analysis Series - Parts I - XXV
Have a great day.
Peace. CryptoGod-1.
Referral links:
Publish0x - https://www.publish0x.com/?a=olejZqrzej
Splinterlands - https://splinterlands.com?ref=rnabc1
Upland - r.upland.me/NQAH
Binance - https://accounts.binance.com/en/register?ref=143611368
NFT Market Sales
Opensea - https://opensea.io/RNabc
Follow Me :)
Twitter - @RNabc123






