
Good day everybody,
Welcome to CryptoGod-1's blog on all things crypto. Today I will be continuing my series on Chart Patterns, which is an area all traders should ensure to familiarise themselves with. In this entry I will be focusing on the Spinning Top pattern.
The Spinning Top
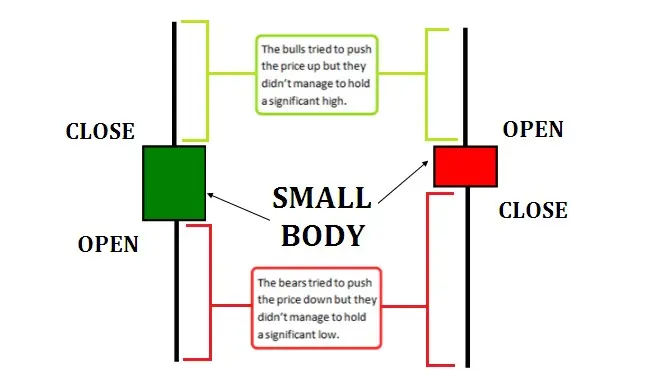
A spinning top is a candle stick pattern which is known for having a short and small body which is vertically centred between long upper and lower shadows. The pattern is a representation of the indecision between the bears and the bulls in terms of the future direction of the assets price. Neither the buyers not the sellers managed to gain a significant advantage in the current trading candle, and that led to the large change in direction between the upper shadow and lower shadow while settling and closing near to its opening price. A spinning top can be seen as a potential price reversal if it follows on from a strong price rise of decline during a trend, and this can be confirmed in the candle which follows the spinning top. It does not matter if the close price is above or below the open price, once the prices are close together. This candlestick is known as a continuation pattern.
How to Recognize the Spinning Top
As one of the most frequent candlestick patterns, the spinning top is a very easy to recognise pattern on the charts. They candle pattern generally forms at the beginning or end of short, medium, and long term trends. This means they can be found on both longer and shorter time frame charts. The pattern can really form anywhere within the charts, and due to its small body centred between its long shadows, it is simple to spot after some practice. The image below from forextradingstrategies4u.com outlines how the spinning top works and how a trader should recognise it on a chart.
The Types of Spinning Top
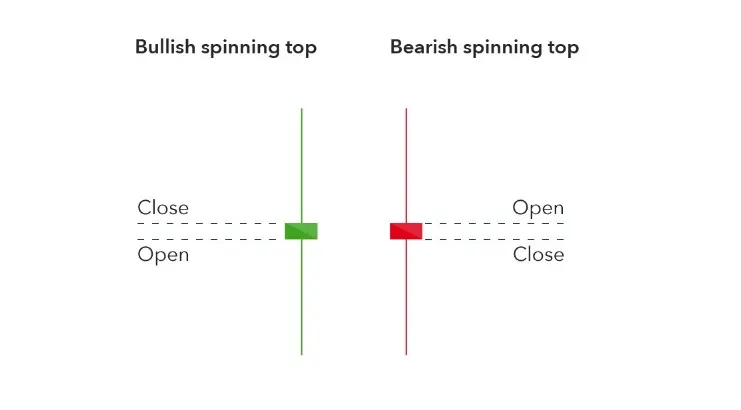
When it comes to spotting the Spinning Top, traders have different theories regarding what each one can mean. Some believe it does not matter what the colour of the spinning top candle is, while others believe the colour plays an important role in determining the type of indecision. The two variations are the bullish spinning top which is green in colour, and the bearish spinning top which is red in colour.
- The bullish formation (green) occurs when the closing price is higher than the opening price. This indicates an upcoming push upwards in price.
- The bearish formation (red) occurs when the opening price is higher than the closing price. This indicates an upcoming push downwards in price.
Below is an image from ig.com showing how the Bullish and Bearish spinning tops look.
Another important thing to take into account is the previous trend, which can have an impact on the meaning of the candle depending on its location within the trend.
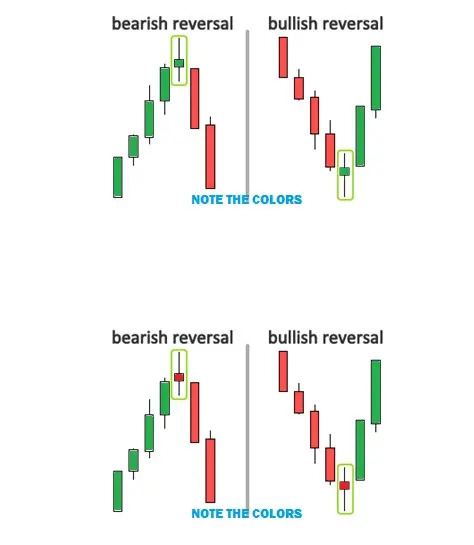
- If the Spinning tops occurs after an uptrend it suggests that the bulls may be losing momentum and a bearish reversal may occur.
- If a Spinning tops occurs after a downtrend it can suggest that the bears may be losing momentum and a bullish reversal may occur.
This removes the requirement to consider the colour of the candle, and instead the trader is focused on the existing trend and potential change in momentum. The image below from forextradingstrategies4u.com represents this theory, as the colour does not impact the price reversal.
How to Trade the Spinning Top
When trading it is important to understand that because the spinning top is a very frequent candlestick pattern, it cannot be used as a reliable technical indicator when used in isolation. The candle is capable of predicting a reversal correctly around 50% of the time, which is not a very useful indicator for a trader. Due to their frequency in the chart, it could mean a lot of bad timed trades if a trades focuses on the candlestick pattern alone. This is why the wider context is important to consider before placing a trade. Making use of another form of technical analysis as confirmation that a reversal may be about to take place can further increase the odds of a successful trade when using the spinning top.
As shown in the images above, when a bearish reversal is predicted by the spinning top, the following candle being a downtrend candle is important as a confirmation, while it is also important to understand that the trend was in an uptrend prior to the spinning top. The same applies for the bullish reversal, with the confirmation candle going upwards and the existing trend being a downtrend.
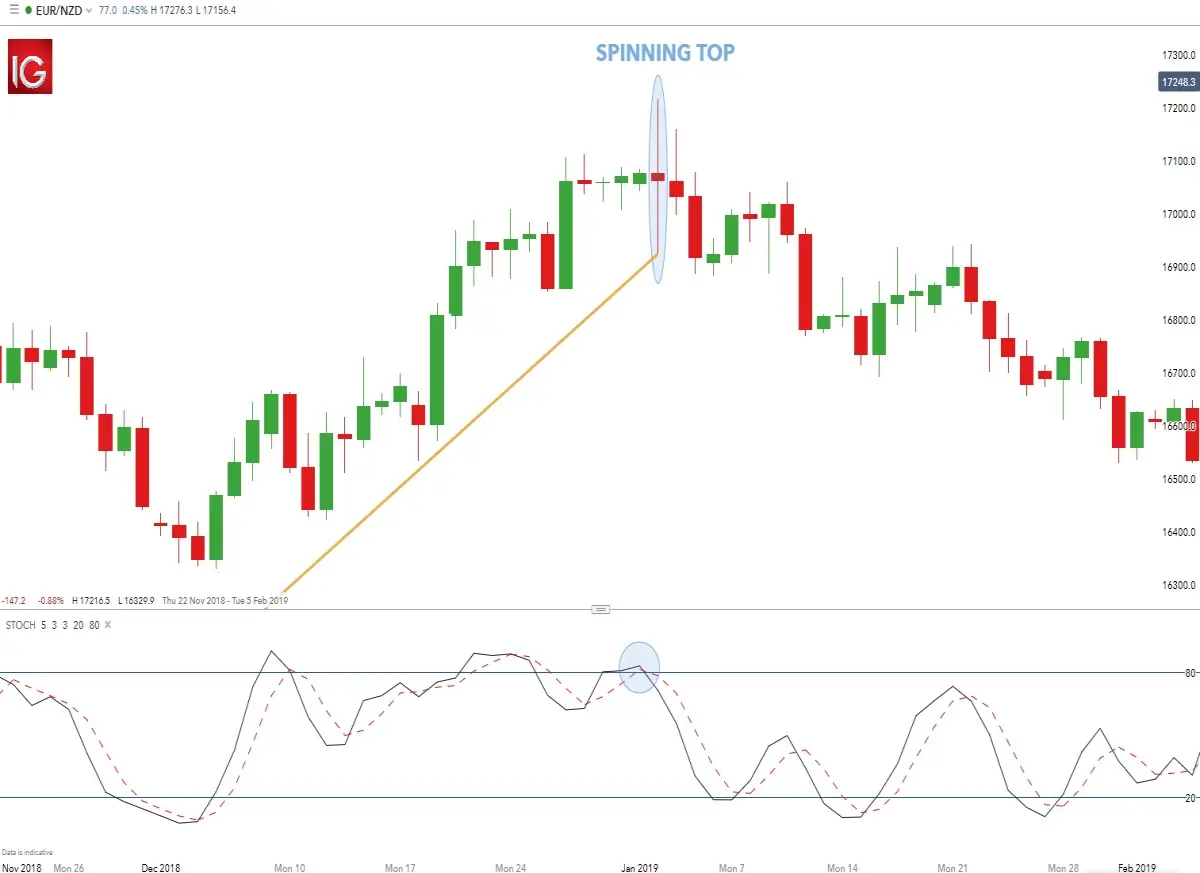
The image below from dailyfx.com shows how the location of the spinning top preceded a reversal in the price action, and how it would have been a good location to enter a short trade. However, as noted above, it should be used with other technical analysis, which in the image below was a RSI which was in an "overbought" position when the spinning top indicated a potential bearish reversal.
Risks of Using the Spinning Top
Due to the fact the spinning top is a very common candle, a trader needs to remember that many of them will be inconsequential. Assets can often have periods where indecision pertains, and a spinning top can frequently appear when the assets price is already moving sideways or about to start moving sideways. Many spinning tops also wont result in a reversal, meaning a trader must await a confirmation to be certain of the patterns meaning. Even with a confirmation however there is no guarantee that a large or impactful reversal will take place.
The candlestick pattern also can be risky to use in terms of its inability to provide a decent level for an exit point in the trade, while also failing to give a good spot for a stop loss due to the fact the shadows above and below the body can be very long. Therefore other indicators should be used such as other candlestick patterns, strategies, or indicators to find a profitable exit.
The spinning top has also been known to get confused as other candles for some traders, especially never traders, who may not initially recognise the difference between the spinning top and a Doji. Both are known to have long shadows above and below, however the main difference being that the spinning top has a body (albeit a small one) while the Doji is known to have no, or almost no, body at all. This is an important distinction as both can appear in similar areas, although both of these patterns do indicate the indecision in the market. It is important to note that if both of these candles appear at the end of an uptrend or a downtrend then it is said to further strengthen the level of indecision being shown among the buyers and sellers.
The image below from ThinkMarkets.com shows the differences between the Doji and the spinning top candles.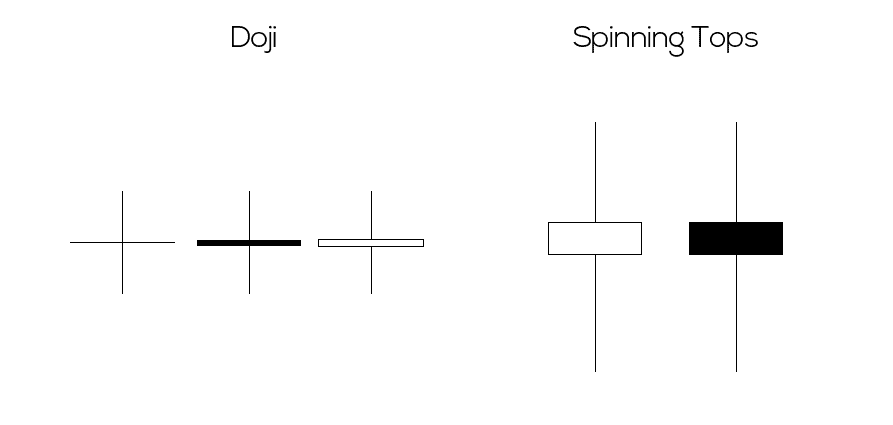
Conclusion on the Spinning Top
The spinning tip is a very common pattern which is known to appear frequently in charts at the beginning or end of short, medium, and long term trends. It is defined by its small body with extended shadows of equal length above and below. Often taken for a Doji due to its similarity, the candles are representations of the indecision in the market between the buying and selling power. Once the closing price finishes close to the opening price, the colour often does not matter when it comes to a spinning top. Having a near centred position in the candle is of much more significance.
The candle signifies that a reversal may be about to take place, depending on where the candle appears in a trend, and often it is advised to used a spinning top alongside other technical analysis and indicators due to many of the spinning top candles being false and no reversal taking place.
You can find the previous parts to the series here:
Chart Pattern - Part I - Understanding Candles
Chart Pattern - Part II - Doji
Chart Pattern - Part III - Marubozu
Chart Pattern - Part IV - Hammer / Hanging Man / Shooting Star
If you would like to check out the previous series I did, which focused on Technical Analysis, you can find it here: Recap of the Technical Analysis Series - Parts I - XXV
Have a great day.
Peace. CryptoGod-1.
Referral links:
Publish0x - https://www.publish0x.com/?a=olejZqrzej
Splinterlands - https://splinterlands.com?ref=rnabc1
Upland - r.upland.me/NQAH
Binance - https://accounts.binance.com/en/register?ref=143611368
NFT Market Sales
Opensea - https://opensea.io/RNabc
Follow Me :)
Twitter - @RNabc123






