
Hello Crypto Friends!!
Exciting News!!
First lets look at the God coin-
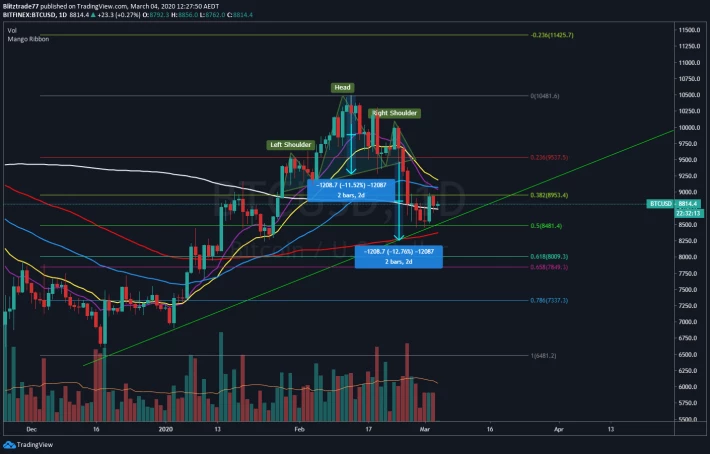
So, Trend line from the bottom, has proved to be solid support. The Head and Shoulder target not being hit, but close enough.
price has come back above the 200 SMA.
Also found support on the 0.5 fib which is a nice neutral slightly bullish retrace area.
My price target of 7600-7700 is probably where most traders are looking to buy, and therefore price might not actually get there.
If we zoom in...
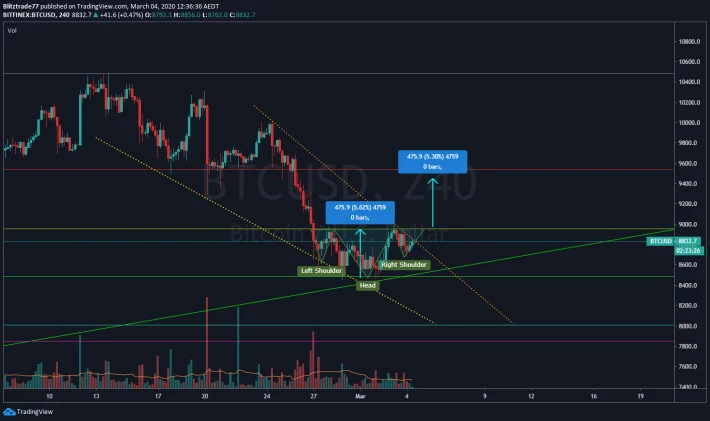
We have a falling wedge, with price now testing the topside trendline. We also have what looks to be a inverse head and shoulder forming, with a target of $9450.
The wedge target is $10k.
I would expect to see this break out very shortly.
So lets look at BAT too -
I thought i would show a weekly chart first as i have not shown this yet -
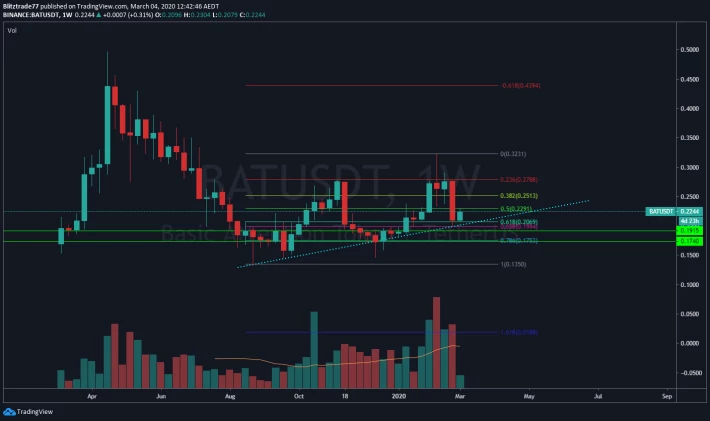
BAT has a legacy trend line formed, which was recently hit and proved to be a solid supporta long with the .618 fib.
If we take this one step further -
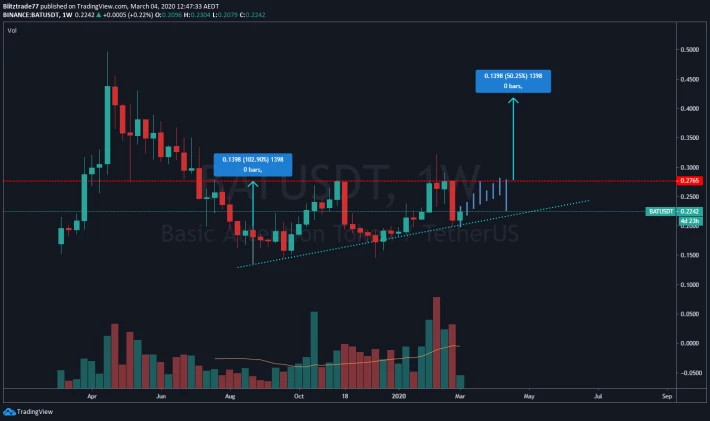
We have an ascending triangle on the weekly timeframe. Watch out for a candle close above $0.2770!!
Now to the 4hr -
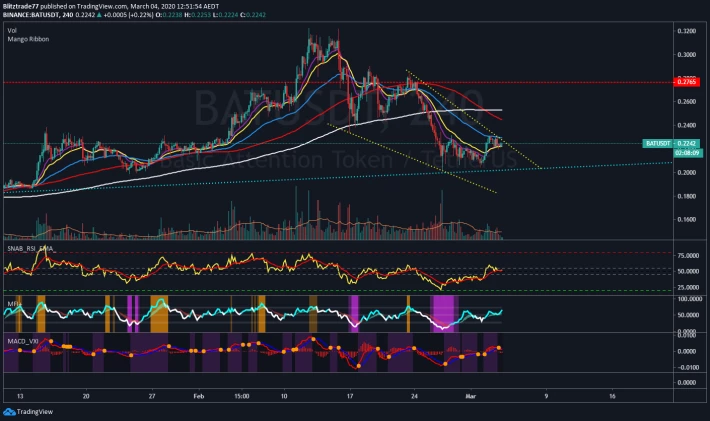
Very similar chart to BTC, falling wedge, a sort of inverse head and shoulder forming, you could call it a cup and handle.
If BTC breaks out then BAT will follow, with a target of $0.2765.
Now lets say it does break out, and reaches its target and stays above 0.2765 for the weekly candle close. We could see fireworks!!
The charts are starting to speak, i wouldn't get too excited just yet, but i would keep a close eye on things.
Happy Trading!





