
Hello Crypto Friends!
If you have learnt all the basics here then its time to learn some extra tips!
I must also point out that there are more detailed guides -
-psychology-and-risk-management
These guides are not super in depth but have enough knowledge to get the basic understanding. Your trading journey should you choose to except it will broaden your knowledge even further on these type of things. Mistakes are the best learning tool!! SO make sure you get your risk management right first!!
Anyway, lets look at limit and market orders-
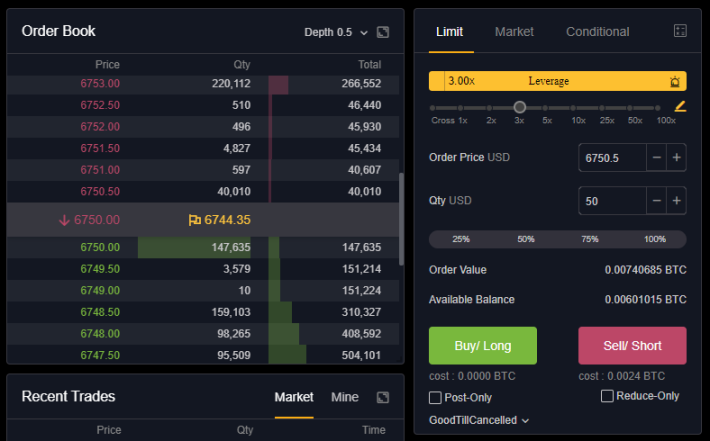
In the top right you can see you have tabs, limit, market, conditional.
A limit order is what you should always try to use to enter and exit your trade when able to.
Why? Because you get paid to do it! What!??! yes, you get paid
Maker Fee-
0.00025000
To work this out, you have to look at the size of your order. So if you did a $1000 order you would get-
1000 * 0.00025= $0.25
So just doing one order of say $100 @ 10x leverage = $1000 u get $0.25, but lets say over time you do 100 of these orders, you will get $25.
This is for your entry and exit orders, so you can see how this can quickly add up.
A market order however will charge you
Take Fee-
0.00075
1000 * 0.00075 = $0.75
Do i need to go any further with this one?! You can work it out how much you will be paying!
A normal stop loss will be a market order too. Limit stops are a bit more complicated and don't always work!
So the lesson here is to always try and use limit orders.
To successfully do this for a buy order, your entry price must be below the current price, and for a sell order, above the price.
You can see in the picture above i have set the price $0.50 above the current order price, thise means the order goes in to the order book and becomes a Maker fee.
Sometimes you might need to layer your orders to try and get an average buy in price.
Next is the Funding rate -
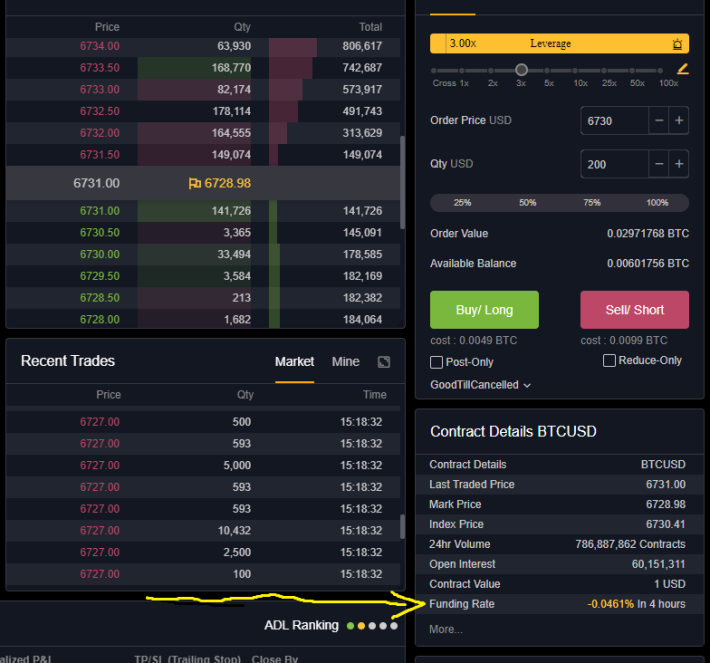
This is normally set at a standard rate of 0.01%. Every 12 hours, the long pay the shorts. However, if the market is overly Short bias, like we can see here then the shorts pay the longs.
This is recalculated every 12 hours, but it gives you a good idea of the market sentiment. As you can see right now, there are a lot of shorts in the market.
A little bit of hidden knowledge, sometimes the exchanges will go against the market, using other exchanges to manipulate the price. This is here say as the exchanges will never own up to it as it is kind of illegal, but its how they can make a lot of money through liquidations etc.
So if the market is overly short or overly long, you might find a sudden reversal. So its not always a good idea to go with the herd.
Funding rates are for perpetual contracts. So its normally not a good idea to keep a trade open for a long long time if the rate is against you. If the price is not moving you are paying to hold your position.
Lastly lets take a look at trading different time frames-
In the previous guide we looked at larger more MACRO time frames. Placing a trade based on the weekly/daily levels and using the 4 hr chart to see closer. These type of trades normally take more than 1 day to execute.
You can however do exactly the same on smaller time frames, for a faster trade.
So lets use the 4 hr, 1 hr and 5 min chart to make a trade.
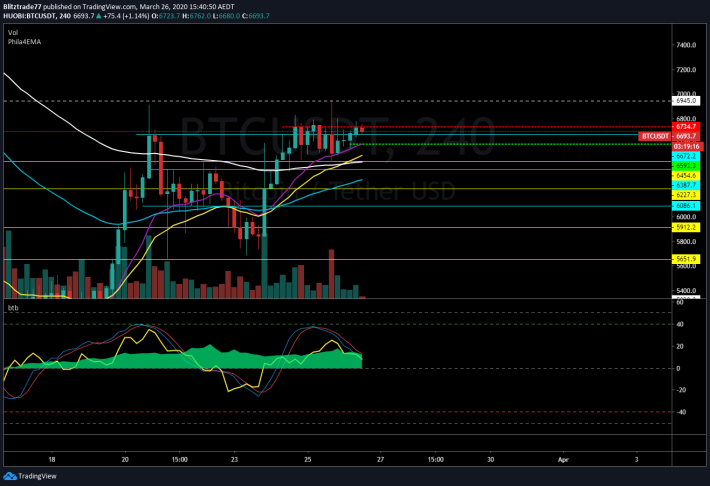
I have left the larger time frame levels in. But i have now marked the 13 EMA on the 4 hr with a green ray.
You can see that we have been rejected by the daily 21 EMA marked as a red ray.
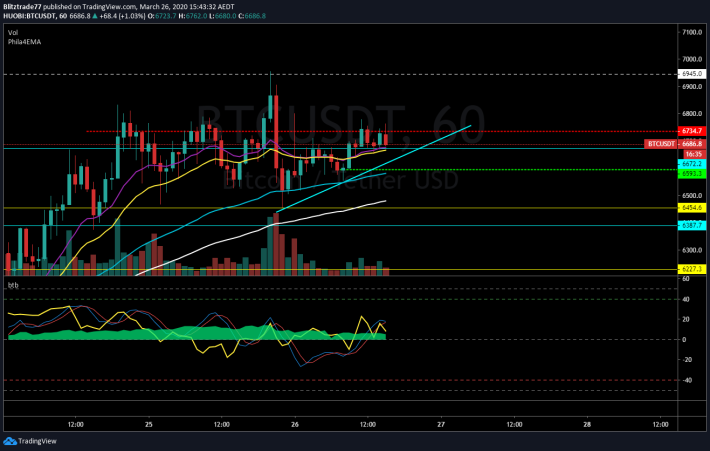
Now on the hourly, we are currently testing the 13 and 21 EMA's, i have added a trend line in too.
The 55 Ema is coming in at the 4 hr 13 EMA level but its below the trend line. So lets put in the 34 EMA instead of the 13 EMA
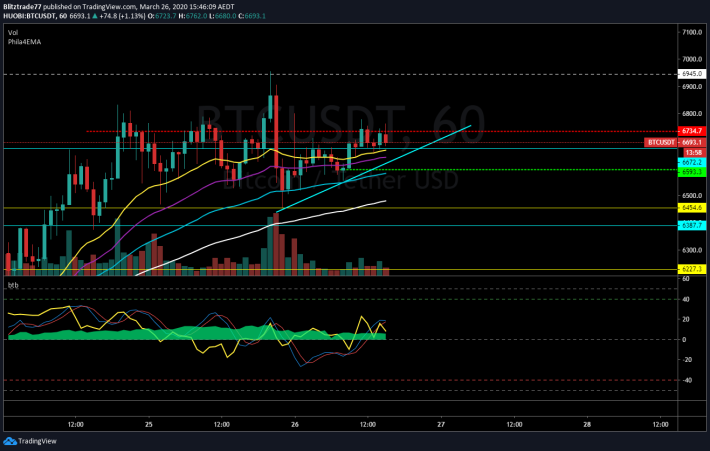
Ok, i can see the 34 EMA will be lining up with the trend line in the next couple of candles.
lets dive into the 5 min -
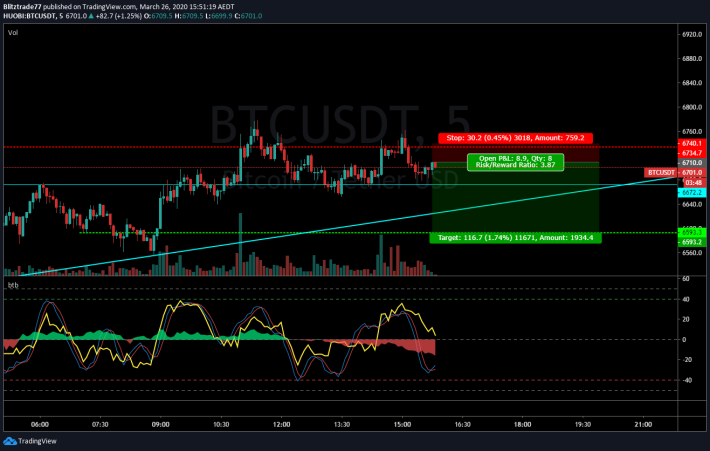
We can use a tight stop loss, here, so a larger size trade is possible. Lets say we have $100-
100* 0.05 = $5 divided by stop loss = 5/0.0045 = $1111
So we will need to use a higher leverage here, 25X or 50X. We could use 100X but only if the stop loss is inside the liquidation price!!!
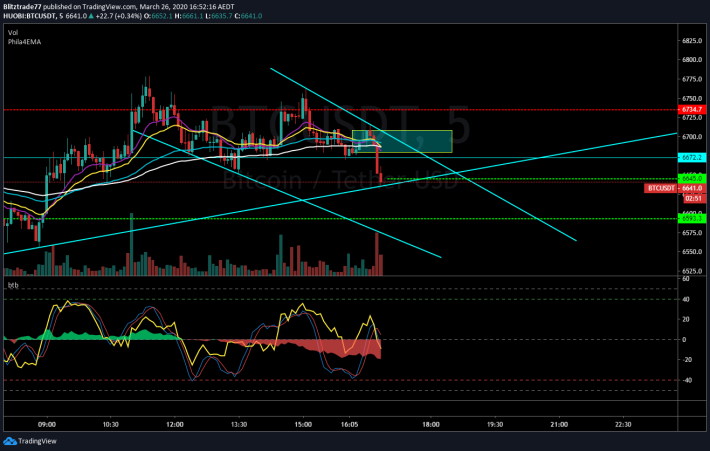
Our take profit targets are the trend line and the green line.
We can see on the indicator that the money flow (yellow line) is coming down, although the stochastic (red and blue lines) are pointing up, so we should try and fill an order in and around the current price.
Maybe 500 at current price, and 500 at just over the current price.
So the yellow box will be good for an order fill. The price is below the EMA's which confirms the trend is down.
It looks like a channel is in play here, but i am just guessing here, this is a tricky trade, it would be better if there was a clear pattern forming like a wedge or descending triangle.
This trade is on the 5 min chart so it should only take a couple of hours to execute.
Recap
- we use the larger time frames to discover direction (rejected by the daily 21 EMA)
- we use the next smaller timeframe to find areas of support/resistance (4HR 13 EMA, 1 HR Trend line)
- we use the smaller time frame to find entry and exit (look for a pattern and indicators to confirm)
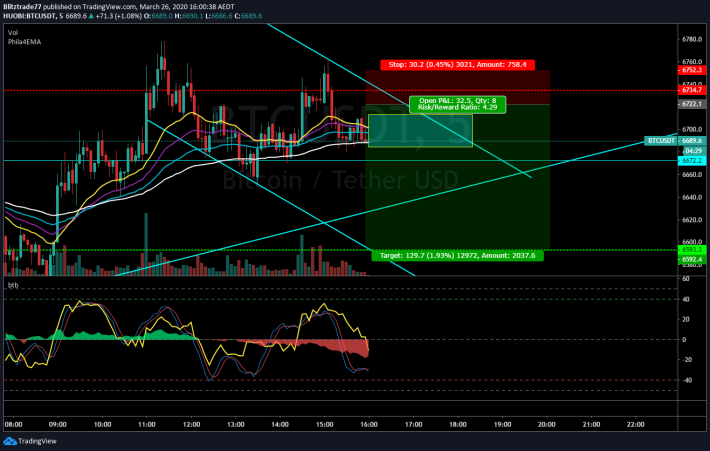
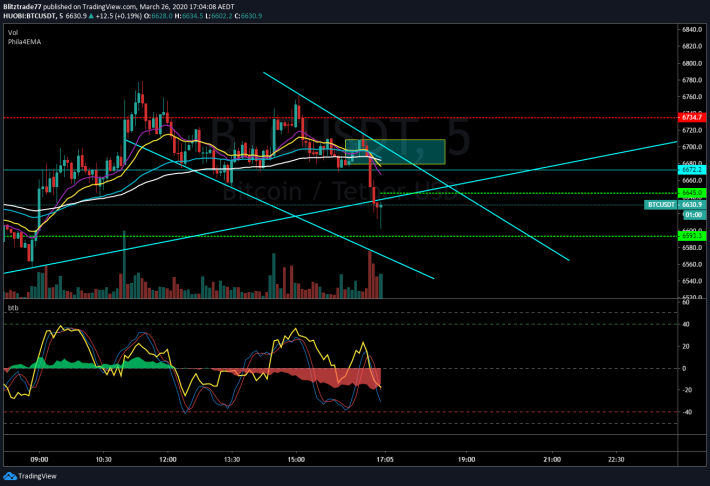
Ok cool. Filled at an average of $6700. I'm literally doing this trade on the fly as i am writing this post, so this trade could go either way.....
However it all looks good. this could be a wedge forming here. The Money flow has come up but now turning around with the Stoch's too.
Lets wait another hour or two. Take 75% profits at 6650 area.
Margin:0.0113 BTC
Entry Value:0.1119 BTC
Exit Value:0.1127 BTC
Profit&Loss:0.0008 BTC
ROE:7.40%
I used the calculator function for this. We can see we will have made 0.0008 on the 750 contracts.
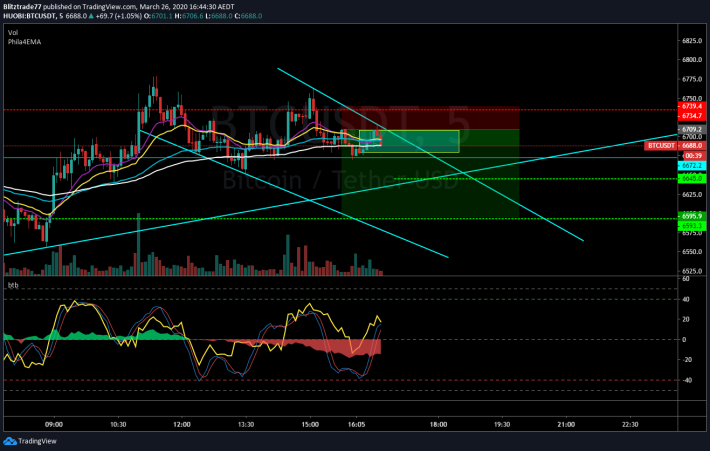
The rest 361 contracts we let ride, but move the stop loss to just above the green line @ $6677.
As i was writing this....
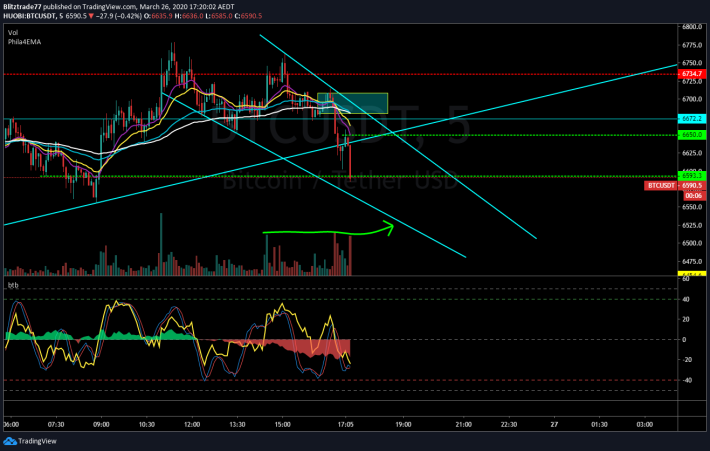
We have profits!! Now i expect a reaction at trend line, hopefully our downwards trend line pushes the price below...

Nope, straight through it!
so our 361 contracts will be sold at $6597 if we get there.
Margin:0.0054 BTC
Entry Value:0.0538 BTC
Exit Value:0.0547 BTC
Profit&Loss:0.0008 BTC
ROE:15.38%
So our total profit will be 0.0008 + 0.0008 + the $0.50 cents from limit trades. Which amounts to about $11 worth of BTC.
Patience!!! hopefully the old trend line of support is resistance now!.

Ok cool, that $6650 seems to be resistance, money flow still pointing down. Move stop loss to $6651.
This indicator is not available at the moment (it is my own project i am building). But you can use MFI and Stochastics seperately.
Ok nice. Trade complete. However you could probably aim lower, this wedge seems to have further left in it. Or you could try and set up a long trade further down.
Anyways, that is a scalp trade. I hope this information helps!!
Good luck!
Happy Trading!


