
Hey Crypto friends!
I thought i would continue with some basic trading skill knowledge. Today will be about the Fibonacci.
If you didn't already know Fibonacci was a great mathematician. Who found that most aspects in life have a sequence of numbers.
Like the number of leaves on a tree, the human anatomy and even trading!
I won't go too in depth here, but if you would like to find out more check here Fibonacci Wiki.
To find the Fib layout on tradingview go here -
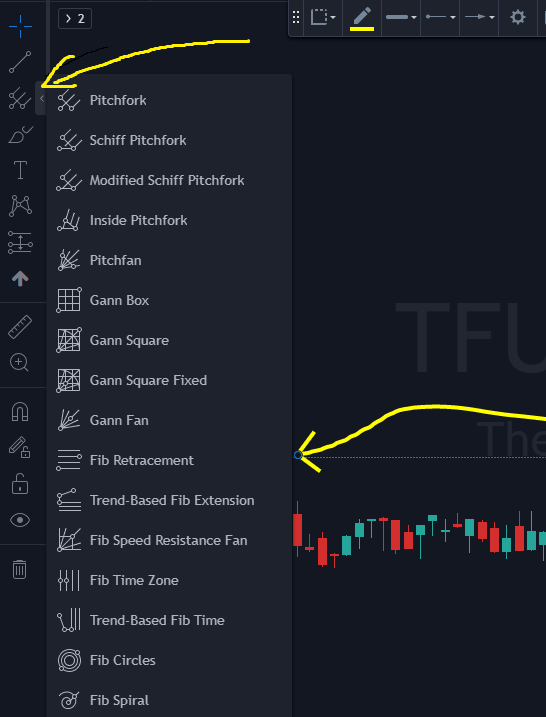
Select the Fib Retracement tool.
To use it you must find the bottom or the top of the area you want to calculate and click, then go to the top or bottom and click again.
It can be used both ways, normally if the market is trending down then you would select the top first then bottom second and vice versa for an uptrend.
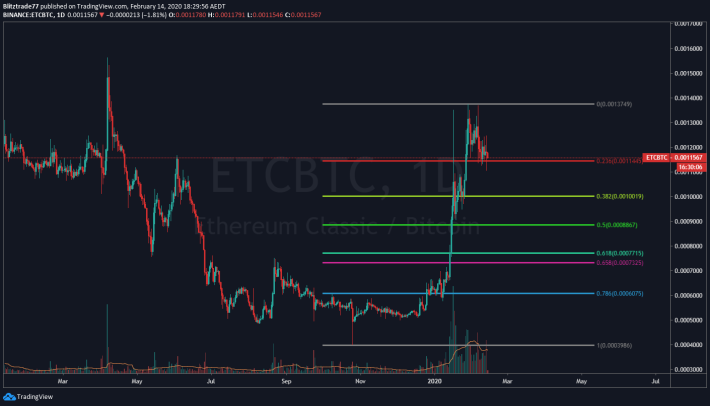
Uptrend ^^

Downtrend vv
Its fairly obvious to see how these levels are respected.
So what does each level mean??
Well.....
I like to think of them as fear and greed levels.
For example if the uptrend retraces to the 0.236 level before going higher, then the market is very greedy (strong).
If it retraces to the the 0.786 level then there is a lot of fear.
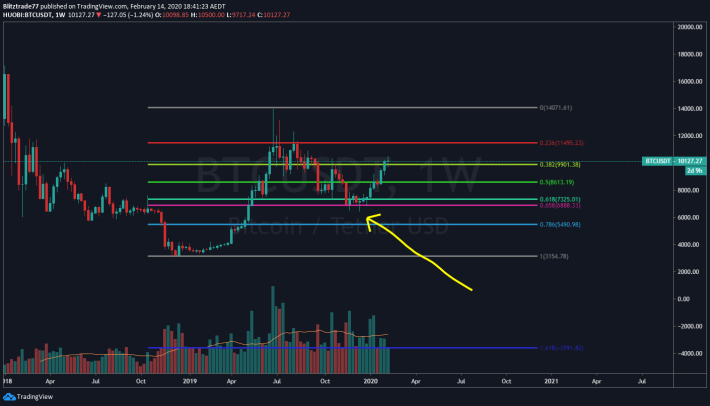
One level stands out above the rest though and that is the 0.618 which is called the golden retracement level.
There is also the 0.65 level which u can see on my chart. Between this and the 0.618 is called the Golden Pocket!
Any retracement that comes to the 0.618 and then "bounces" is considered a very healthy market and there should indeed be continuation.
Here is an example:

Good old Bitcoin on the weekly chart came right into the golden pocket in 2019, and then......
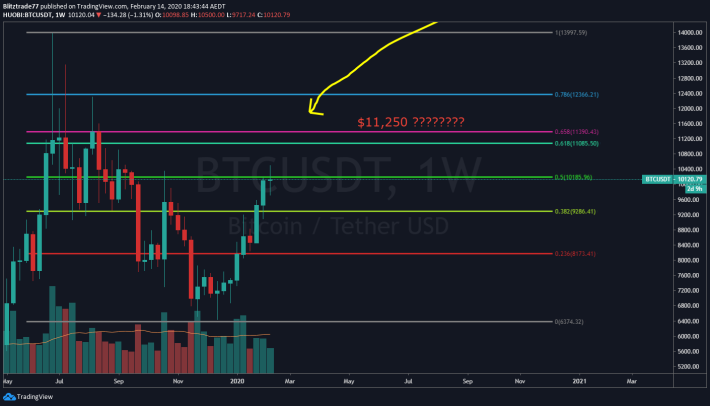
It did it again!!!
So here is an interesting chart to leave you with..........
Happy Trading!


