
Hello Crypto Friends!
Guide 2 is here
I thought i would write a mini guide on how to trade in () steps.
First lets get the basic knowledge done.
You will need a charting platform. Most trading exchanges have charts built in and you can use these. However i would recommend getting a free basic Trading View Account here. You can pay for a premium account if you would like access to a few extras, but it is not necessary.
Candlesticks- I won't go into detail here as there are advanced ways to reading candlestick formations. I will cover that in another post.
All you need to know right now, is that a candle has an open price, a close price, body, and wicks.

Looking at the green candle. It is green because it closed at a higher price than it opened.
The body is the main coloured part of the candle, normally most the price action took place here.
The wicks are where price has been during that time frame.
This is a weekly candle, so 7 days of price action.
Ok next we need a few indicators.
1. Moving Averages
These are the average price of the previous candles. So for Example a 10EMA - is the average price of the last 10 candles.
Here is one on Trading View you can use-

So click the indicators tab and look up 'EMA' and pick one with at least 3 EMA's. If using an exchange chart, u might have to add 3 separate EMA indicators.
Next lets put in some numbers -

Click on the settings tab on the indicator (top left).
Go to the inputs tab, and put in
13 - This is your fast moving average
21- Also a fast moving average
55- A medium
89- A slow moving average
The picture shows 100 as the last number, either is ok. The reason for using these numbers is they are Fibonacci numbers. This you will have to look up yourself or wait for me to write a seperate guide on.
Next
RSI - the old favorite of any experienced trader - the Relative Strength Index - A momentum indicator that tracks price.
This indicator is great for seeing if the price is getting too high (overbought) or too low (oversold).
Overbought is normally around the 80 marker and oversold is normally around the 30 marker.
However, just because the RSI is at 80 does not mean the price is suddenly going to go down. It is just an indicator!
Knowing this fact though, u can use it to find Divergence. Which is simply when the price is moving one direction and the RSI is moving another. We will come back to this later on. First get the indicator the same way as you got the Moving Averages.

So we are set up now. We have the RSI indicator and the EMA's. I like to change the styles on my EMA's as shown above.
I have set the 13 to purple 100% opacity with the 2nd thickness setting.
21 -Yellow
55- Blue
144- White
Ok, lets find a trade-
Step 1.
Support and resistance, on the weekly time frame-

The 'W' tab up the top is the weekly time frame. We need to also get horizontal line tool as shown above.

So i have put in horizontal lines, i also changed them to dotted and white using the tools bar.
You can see that far left we had support at this price level, which is now acting as resistance on the right.
In the middle we had a Resistance level, which is now acting as support. These are the weekly price levels and have a big influence on price.
Now lets do the same with the Daily time frame-

I have made these levels yellow, try to use the candle body closes, however if there are lots of wicks touching a particular level, you should mark these as well.
Do the same for the 4 hr-

I used light blue and i also used horizontal rays.
Alright the chart is starting to come together.
Step 2-
Find the trend. Uptrend or Downtrend.
An uptrend has higher highs and higher lows, normally more green candles than red.
Downtrend has lower highs and lower lows, normally more red candles.
We can see that the trend is up. So we should look for 'LONGS".
Step 3-
This is where the EMA's come in to play. These are trend indicators and can help you find entry points.
So zoom out -

On the weekly, the EMA's are too far away at these point, however they won't always be. But for these time we will not use them.
Lets go to the daily-

So the daily we have the 21 EMA (yellow) right on the price. The 13 EMA is below, lining up nicely with support levels.. If you like you can put in another horizontal at the 21 EMA, which i have done in red on the next chart.
4hr-
Now lets find a trade-

Using the tool 'long position' you can mark out your trade. I have put the entry point at $6454 on the daily support level. I have put the stop loss just below the 4 hr support, which is also below the 13 EMA.
Key points- Stop loss is a smaller percentage than target. The risk reward ratio is 5.52. The gain is 7.56%, the loss will be 1.37%.
If we lose on this trade we take a small loss, if we profit we take a big profit.
Lets say you only have 50% of your trades profitable, and 50% unprofitable. In the long run you will gain. Because your profits are higher than your losses.
Now, that's the first part of risk management, the second is your position size.
Lets say you have a $100 balance. To take this trade we must find the position size. Lets say we want to risk 10% of our balance on every trade.
100 x 0.1 = $10 risk.
Now to find the size we put on the trade, we divide that $10 by our stop loss percentage.
10 / 0.0137 = $730
Using leverage we can use $730. With 20X leverage we would need -
$730 / 20 = $36.5
So we enter our trade on the exchange as such-
730 contracts @ $6454 - BUY
Stop loss @ $6367
Take profit @ $6945
Depending on what exchange you use, this info will need to be entered in somehow. I use mainly Bybit as they are a good exchange, good support, no down times, easy to use and they have bonuses too. You can sign up here Bybit it only takes a few minutes. They have a series of bonuses where they give u free BTC. So If you are a beginner you could just deposit some BTC claim all the bonuses and just use the free BTC to start trading with.
To enter this trade you would use it like -


Then sit back and watch!. Patience is key. Try to hold back on emotions. If you don't get your entry point and the price moves away, then don't take the trade. Wait and watch for the next one.
Your entry to trade is a key part, If you can start a trade and go into profit early then you will feel more comfortable. It will also help you with your stop loss - WHICH YOU SHOULD NEVER CHANGE - So get it right the first time. The math is what makes you profitable so u must obey it.
Now lets say you get into your trade, one thing you can monitor to help you know if you will actually reach your target is the RSI.
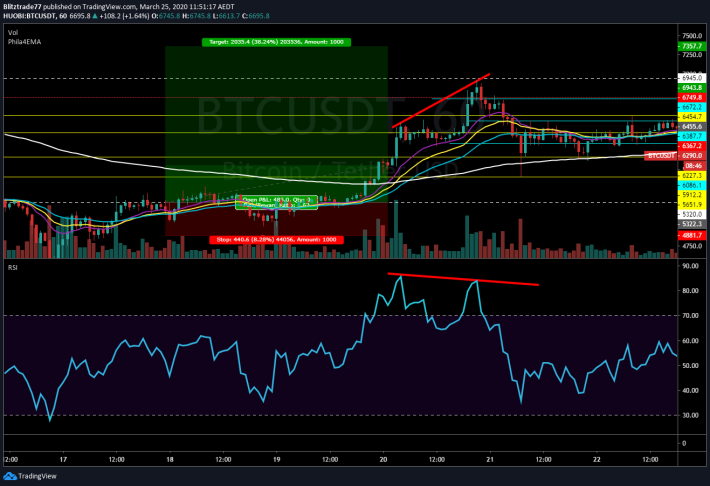
Lets pretend you were in this trade, targeting 7k. However notice the price is moving up, but the RSI has made a lower high. This would be a great time to exit your trade. This is called a regular divergence.
You could also use this to enter trades-
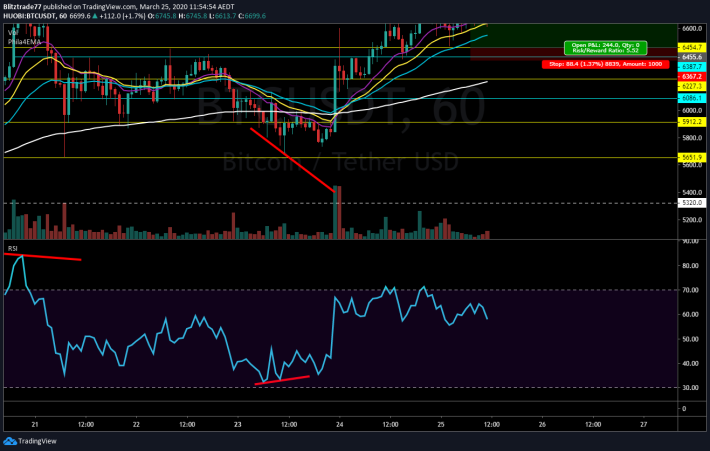
This was a great example just recently.
This should be enough knowledge to start practicing and learning how to trade. If you can master these basic skills you are already a profitable trader.
Wow, this post is long already..... hope it helps!!
Happy Trading!
Update-
Did anybody take that trade???!
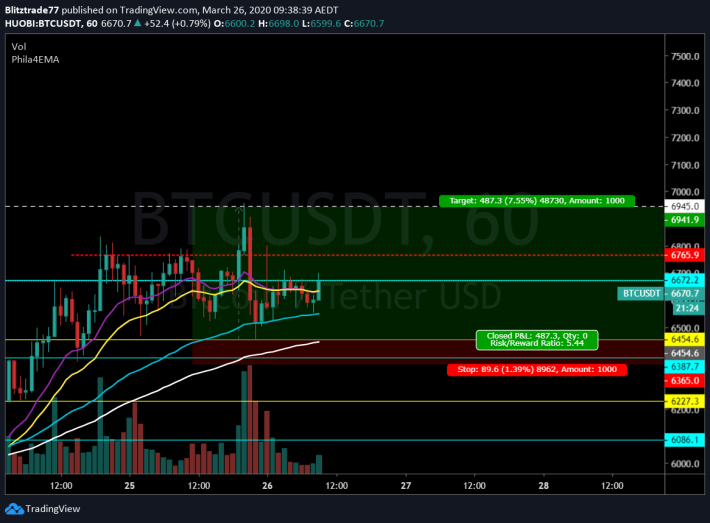
You can see how useful these levels are.
Guide 2 is here


