
Hello Crypto Friends!
Today we will explore trend lines and how to use them.
Firstly the simple trend line.
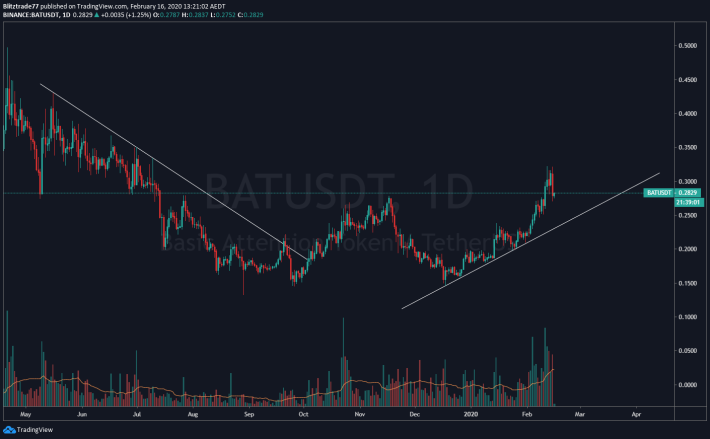
Here we have BAT USD
I have drawn a trend line on the top of the downtrend. I like to use wicks rather than candle bodies, but u can use either.
A trend line is valid with two touches, but 3 or more is better.
On the right i have drawn the trend on the bottom, as BAT is on an uptrend.
When the price gets carried away from the trend line, its more than likely it will revisit it. This creates opportunities!
Shorting BAT when it hit the downtrend line and longing BAT on the uptrend line would have been ideal trades.
However, BAT and most Altcoins are starting to create parabolic uptrends.
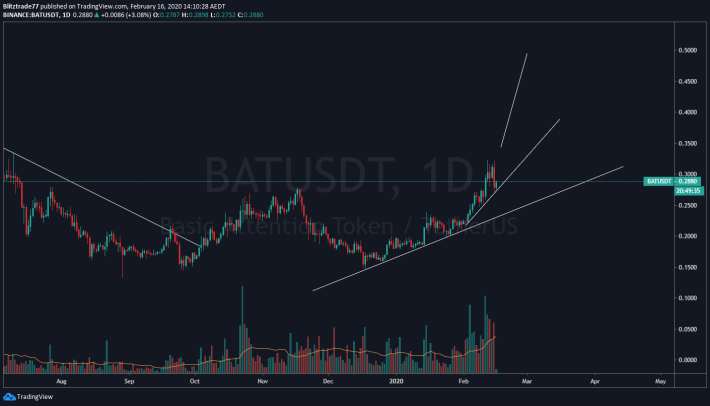
We could well see the next phase go vertical, into a blow off top!
If this new more aggressive trend line holds then i would expect the next trend line to go vertical.
If that is the case, watch out for a candle that has a huge wick, and big volume, that is your chance to get out of a trade if you are in one. Or enter a short.
At that point, we can expect the price to move down to the original trend line.
Now lets add fibonacci to see if the trend line matches up somewhere if the 2nd trend line does not hold in the short term.
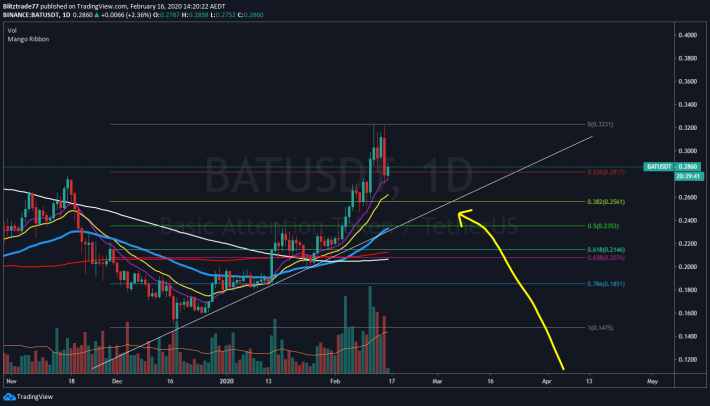
Looks like a good opportunity at the .382 and 55 EMA (Blue line) should the price continue to move down.
Adding this to your horizontal support and resistance knowledge and you are well equipped to find the perfect trades.
I hope this helps and like always...
Update!
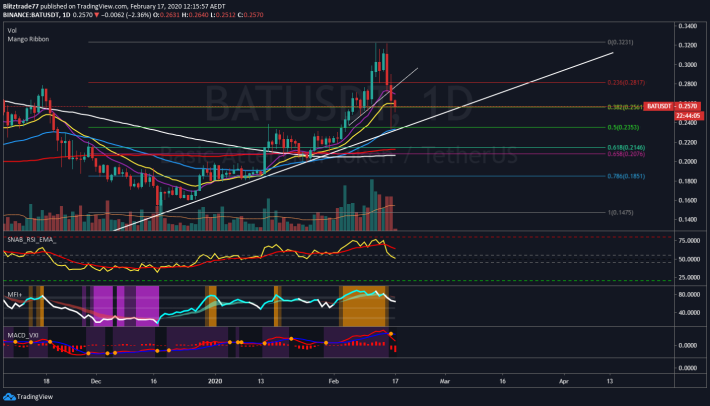
The power of trend lines!! It actually sold off aggressively, so it was able to hit the 0.5 fib and 55 EMA, but bounced very nicely!
Happy Trading!
If you haven't seen this post yet, check it out! Atom Records
Listen to music while trading and get paid for it!


