
Hello Crypto Friends!
Lets take a look at patterns, how to find them and how to trade them. I will break them up into different posts so that there is not too much information on one page.
Firstly lets look at Triangles.
There are 3 types:
- The Symmetrical Triangle -
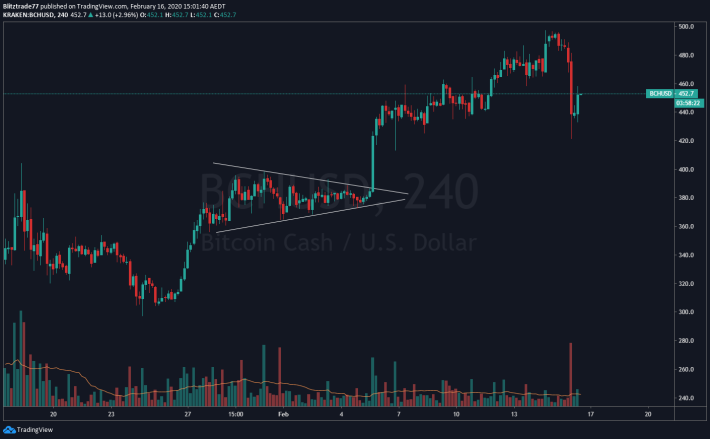
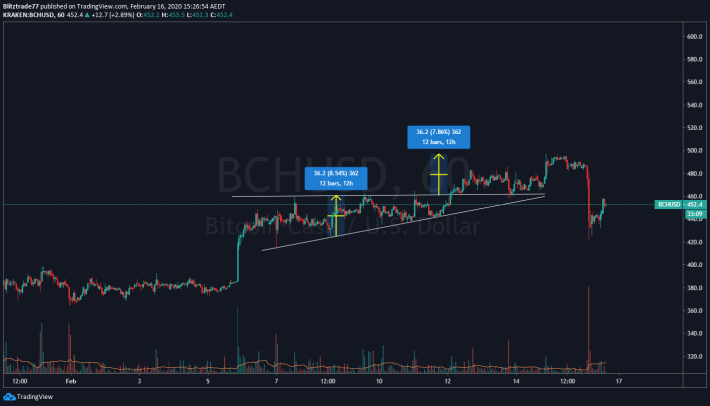
BCH USD on the 4hr. This was a perfect symmetrical triangle. It has other names too, in this case a bullflag.
This is basically where buyers and sellers are slowly pushing the price into a tight range, and eventually one loses.
Because BCH was in an uptrend, the probability this triangle breaks upwards is higher. Once the pattern breaks, u can see how crazy the price moved!
The conservative way to trade these are to wait for the breakout and try to get in on the action. You would have to be ready to act fast as the price can move quickly.
Make sure to put your stop loss back inside the triangle as sometimes there are fakeouts!
The other way is to go with the trend, in this case you would try to go long on the bottom of the triangle with your stop loss below it. This is more profitable!
Targets for Symmetrical triangles -
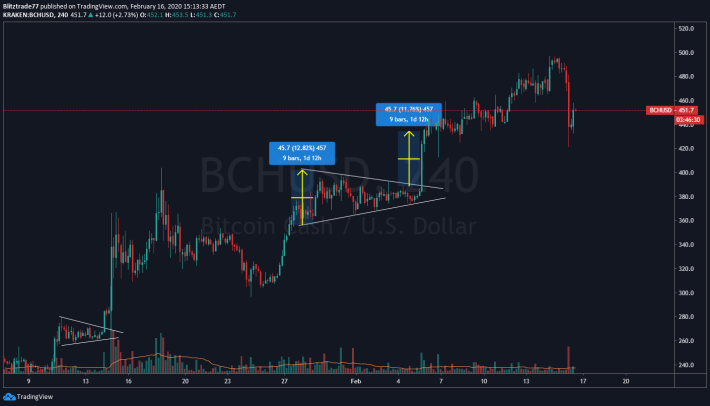
The first target is the measurement of the triangle height somewhere near the back of the triangle. As shown. BCH over performed a little here but i would be happy with profits.
The second target in this situation (bullflag) -
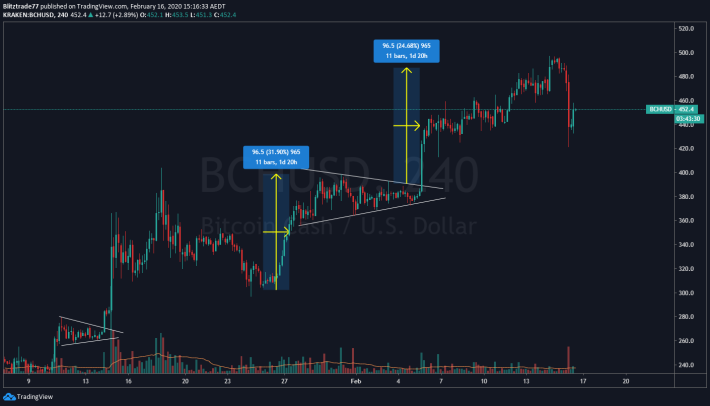
The measurement from the start of the flag, to the top. BCH met this target very nicely as you can see.
- The Ascending Triangle -
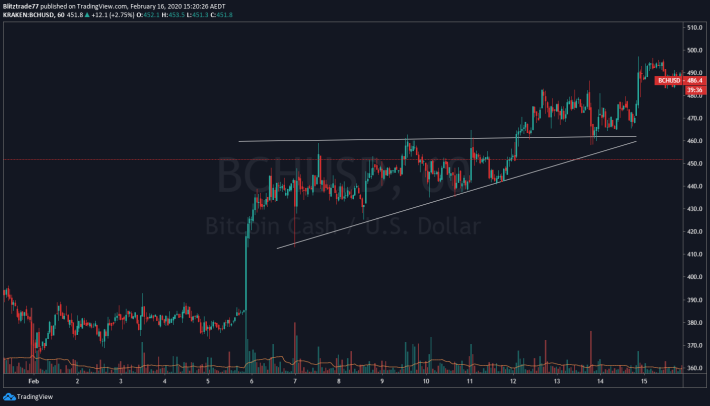
A flat wall of selling at the top, with the buyers slowly pushing up.
This is a bullish pattern and has a high probability of breaking up.
How to trade-
Conservative way is to wait for breakout, however you do not always need to act quickly. I find they tend to break up but then have a retest of the flat line.
So you can put your long order in on the top line, as you can see the retest was perfect!
Aggressive way is to buy on the bottom trend line with stop below, again more profitable!
Measurements for targets -
I normally go for somewhere around the middle, but back a little bit.
To do these measurements i use the date and price tool on tradingview -
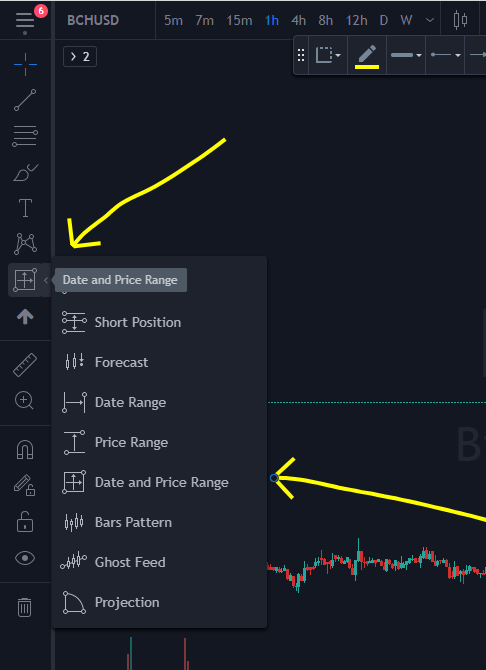
Once i have the first measurement, i then hold CTRL and left click then drag the cloned image to the breakout point.
There is a Ascending triangle forming now, check out this update - Chainlink
- The Descending Triangle -
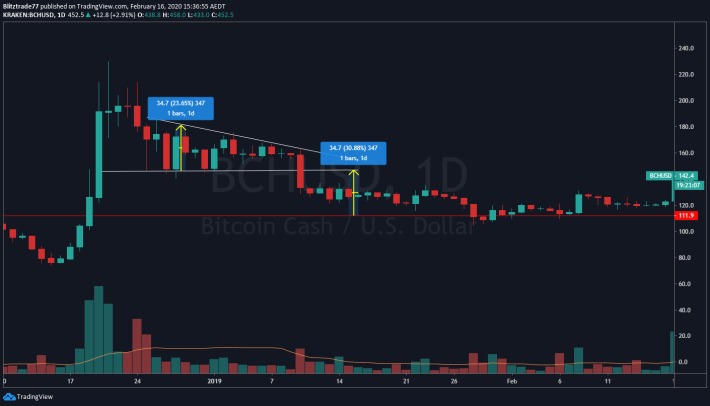
The same as the Ascending triangle but inverse. Trading and targets are the same. This one did not retest the line.
Triangles appear a lot, and on different time frames. Just remember what time frame you are looking at to determine how long to hold the trade for.
Here is a triangle that just occurred -
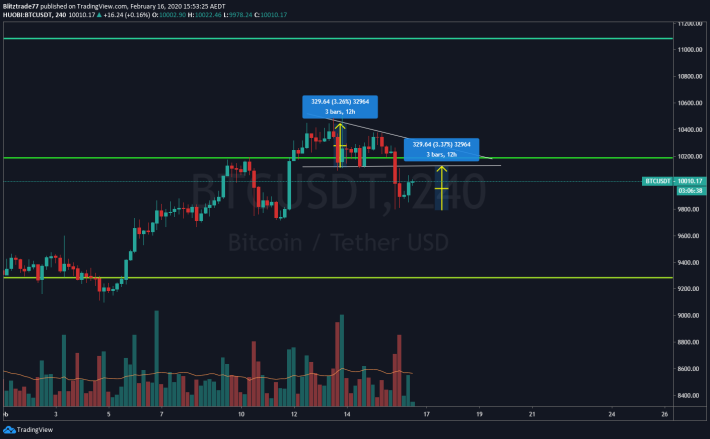
I expect BTC to be back at $10,300 by monday, Then to $11,250 by end February, before the real correction happens. Not financial advice, but that is my prediction.
Happy Trading!
If you haven't seen this post yet, check it out! Atom Records
Listen to music while trading and get paid for it!


