Hello Crypto Friends!
The Next pattern on the list is the Head and Shoulders.
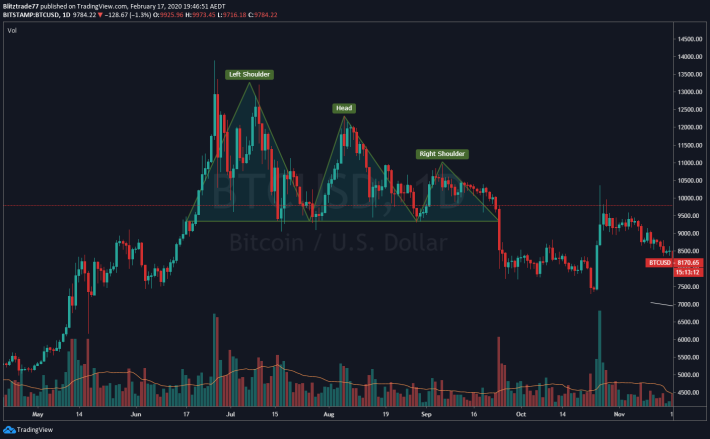
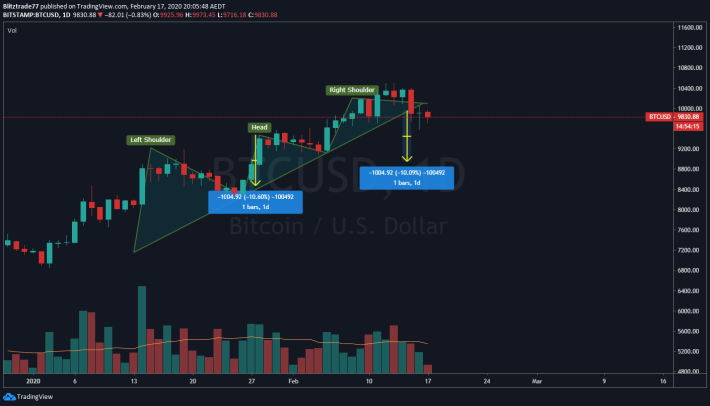
The pattern consists of 3 phases, the left shoulder, the head, and the right shoulder.
They can sometimes be hard to spot, the biggest outlier in my opinion is volume.
The left shoulder has the highest volume, then a spike for in volume for the head, and a little spike for the right shoulder.
It has a support called the neckline.
Once that support breaks the pattern is complete and a target can be drawn.
The measured target is the height of the head from the neckline.
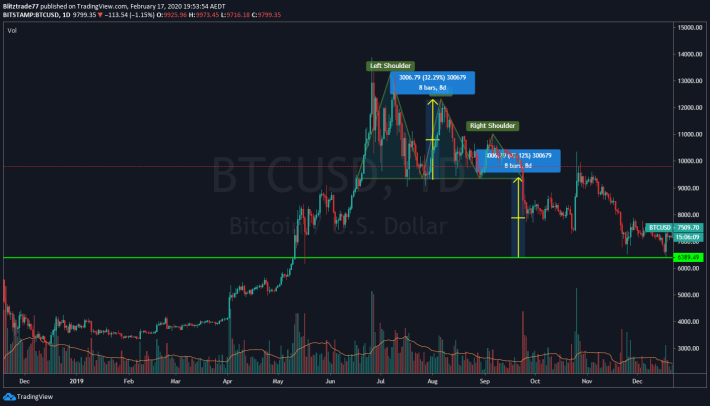
As you can see BTC hit the target to the $$ on this one.
Often these patterns get a backtest of the neckline. Which u can see happened, but after a long time. (The 40% pump day)
This is the bearish from of the pattern.
There is also a bullish form of it, called the inverse Head and Shoulder.
Not always the easiest pattern to see, but happens alot in BTC world.
Trade these like any other pattern, less risk is to wait for breakout/backtest of neckline.
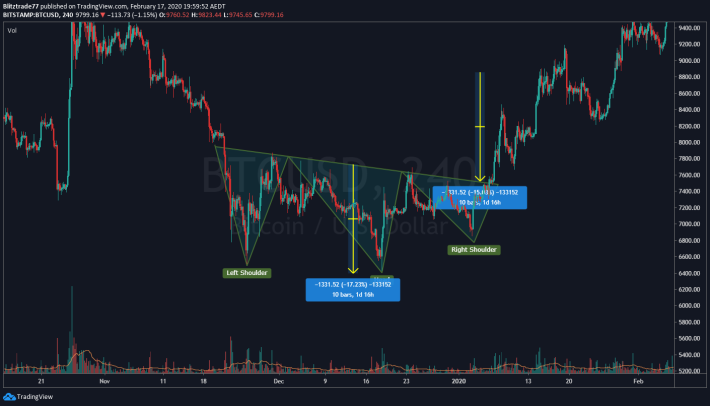
Now i have something i just noticed and would like to share with you....
Volume profile matches, the backtest has occured and the target is $8950.
And on the hourly....
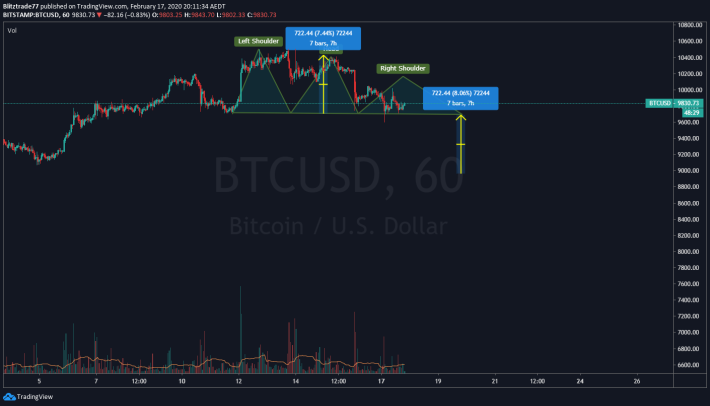
Same target. $8950
Lets see any confluence -
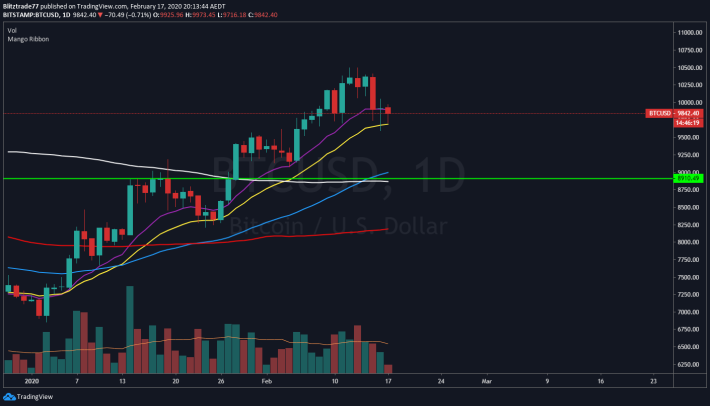
Area of support and the Golden Cross! 55 EMA and 200 MA.
Happy Trading!!!
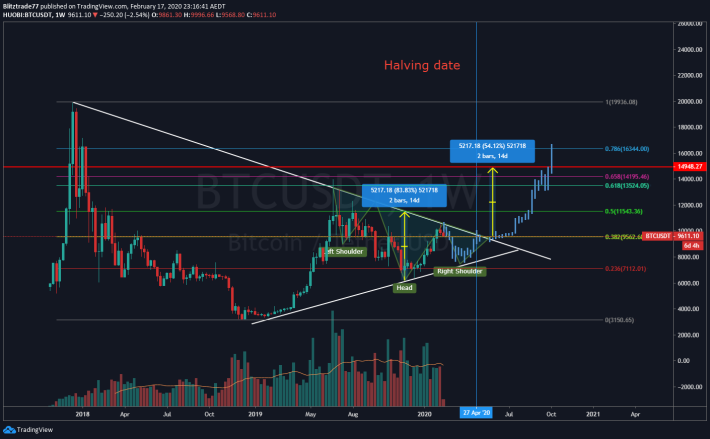
Thought i might throw in a prediction chart tooo -