
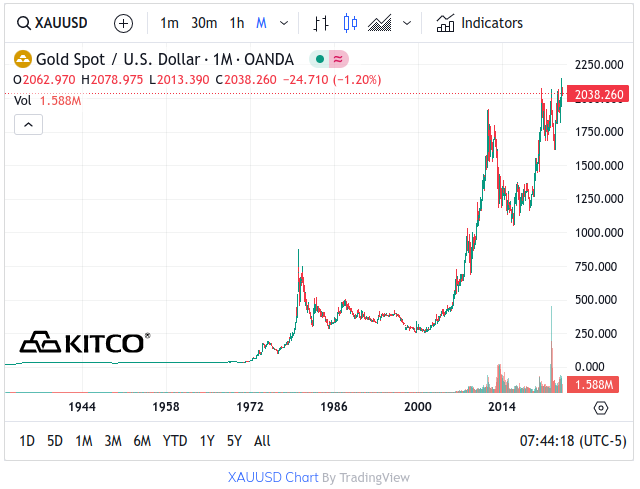
The average gold price going back decades reveals a startling pattern, the bottom for gold is on the rise. For the better part of two decades, between 1996 and 2006, gold averaged around $350. The massive spike to over $1,900 (May, 2011) that follows is a result of the Great Financial Crisis, of which I believe still hasn't been resolved. It also eventually resulted in a new bottom for gold of around $1,250 which lasted approximately 6 years between 2013 and 2019. That's an impressive $900 increase in price for one ounce of gold, an increase of some 250%.
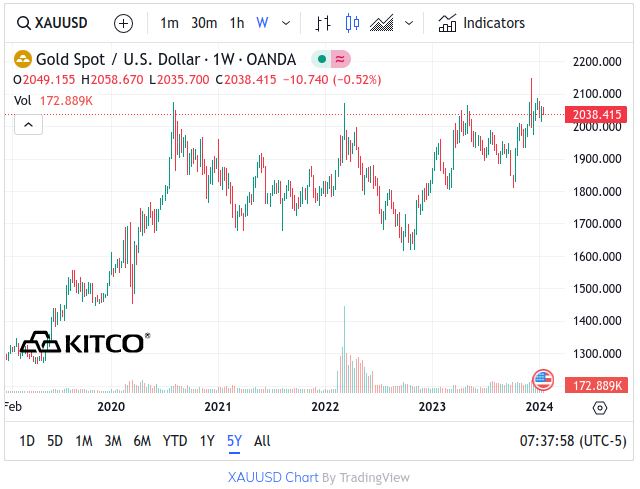
The chart below is Kitco's 5 year gold chart. It clearly shows that gold has disposed of its previous $1,250 bottom. Not only had it set a new, higher bottom but it apears to have now done it twice in the last 4 years, most recently just in the last 2 months. We can see that from 2020 up to the Fall of 2023, gold had found a new bottom around the $1,850 mark. This is a $600 per ounce increase from the previous bottom of $1,250.
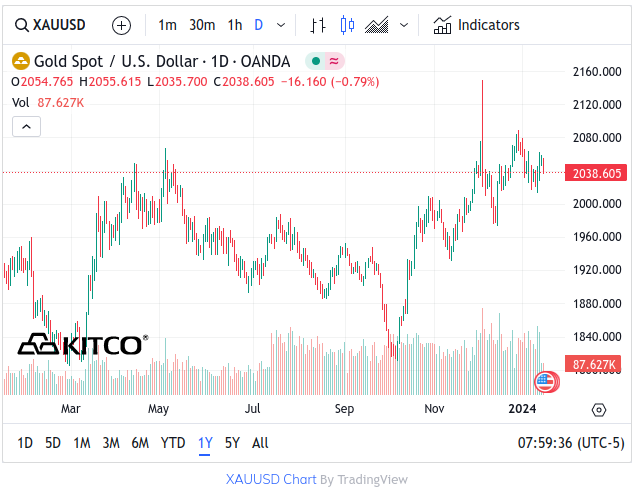
Having a look at the one year chart for gold, we once again see that gold has begun another steady climb upward, starting around October 7, the day of the Hamas attacks on Israel and the ensuing war in Gaza. Gold hit a new high last December, as seen by the single red spike line. From there, it appears to have settled into a new bottom around $2,040. This is a $190 per ounce increase from the previous bottom.
Looking again at the multi-decade chart below, it should be obvious to anyone who sees it that the forward trajectory for gold is upward. Gold has left its previous lows behind and we are now consistently seeing higher lows and higher highs. Gold shot to more than $2,140 last month in an intraday high. I expect that record to be broken and soon. Word is out that the Federal Reserve will start cutting back on quantitative tightening from $60B to $30B starting as early as March and possibly sooner as well as cutting back interest rates. With national debt and interest payments spiraling out of control along with massive budget deficits, my crystal ball says more money printing is on the way in the form of quantitative easing. Of course, this increases the national debt and interest owing. I can almost hear the suction sounds...
Money printing will decrease the value of the dollar, elevating the cost of owning gold. I made sure to diversify my assets which include property and crypto to include precious metals and even food. Also, the war in the Middle East is not ramping down, it's ramping up, affecting trade routes. Yes, gold might get smacked down again as has happened so many times before. Let that be a buying opportunity!
Here's a recent post from Kitco News, 'Gold market holds the line at $2,050, waiting for another catalyst'. Looks like they think gold's new bottom is $2,050???
Your comments are appreciated. Please share your thoughts in the comments section.
See reference section for more info, thanks.
Peace and love to everyone!

Most Recent Posts:
Bitcoin pump and dump. Blame the Koreans?
Bitcoin Ordinals - A new Library At Alexandria?
Bitcoin goes to $48K - Onward to $50K?
Tipping - A powerful component of PublishOx.
Tectum's TET up 280% since Dec. 26, 2023.
January tour of my new $400 8'X8' greenhouse.
U.S. national debt hits $34 Trillion!
Gold closes at record year end high.
Argentina now accepts Bitcoin to settle contracts.
Thank you for supporting my sponsors.
Buy Silver! Visit my eBay channel.
Cooper's Cask Coffee Co. 10% Off First Order. Use Code 'FIRSTTIME'
Milk Road - Bitcoin newsletter
Bitify - Buy and Sell Bitcoin marketplace
Fire Maple Gear. 5% Off First Order Use Code 'FM5'.
ShareAsale - $$ Affiliate Marketing $$
I'm also on Substack with occasional new podcasts and now also on Twitter / X.


