
Hello, I will now provide a very good BTC price analysis.
https://www.tradingview.com/chart/BTCUSD/3CieRkFX-9-day-chart-unhappy-with-the-pump
 On the 9 day we are overpriced, the blue wave is over 100, this has happened 3 times in BTC history and it always corrects. Let me say that a correction in this movement can be flat, it does not mean a dump. Moving flat for a bit can bring that wave to levels due to pump again, and I do expect this. I saw that Greyscale raised 700 million USD, I am assuming to buy more BTC but I could be wrong. Expect flat prices on the 9 day.
On the 3 day we have this:
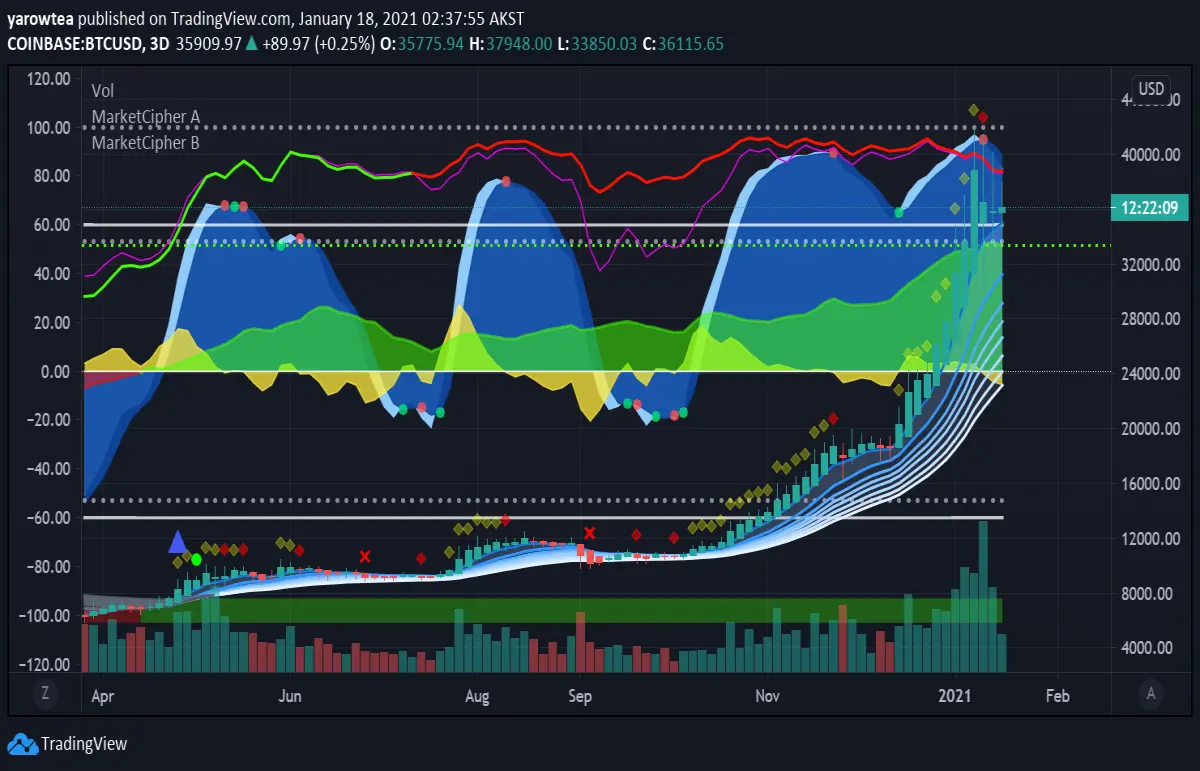
Some weakness, some strength in holding price too. See why I think flat price for a bit?
On the 9 hour we have:
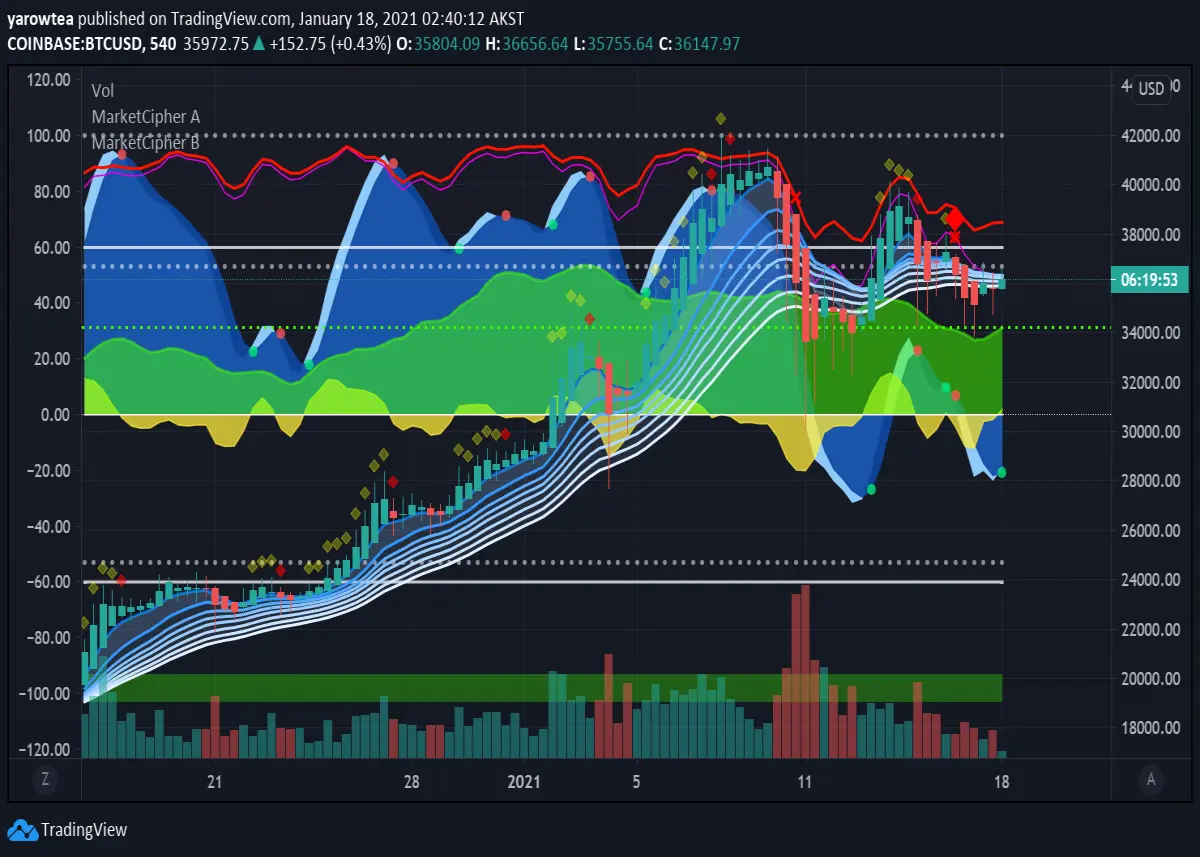
We have it flowing into the green but not keeping that upward green infinite price gain going, this is why the price has not broken down yet, no major dump. At this point BTC is really wanting to trend flat and allow BNB and defi coins that go with the flow to flourish as BTC sits there and takes a breath, profit taking going to ETH based assets, defi, gold, and luxury goods. When the next round of long term investors come, it will all change but from 18k-40k BTC has had suspended belief, no once can imagine it hardly, but I just went shopping and wine I used to buy for $4 is now $12, 3X vs BTC 58x same time frame. So after some inflation and logical thinking, BTC is up 18x against wine perhaps, a reward for understanding liquidity and stable price long term. If we were to try to price gold to keep up with all the inflation, we would have to just pump gold like BTC but have no way to trade our gold worldwide. Just compare the M1 of the USD to BTC same time frame and its obvious.
https://fred.stlouisfed.org/series/M1
Finally lets look at what the BTC miners are selling:
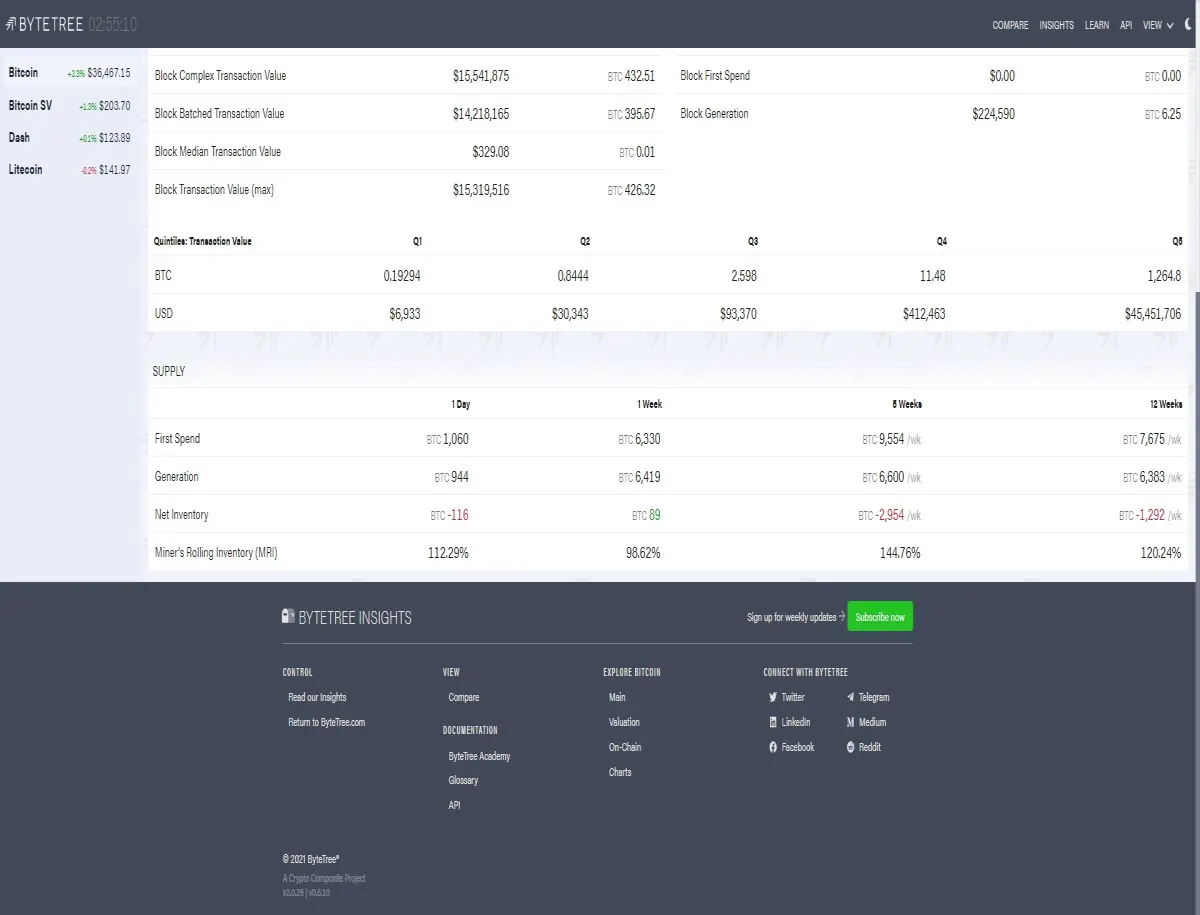
We can see the miners are selling 1200 BTC a week over 12 weeks average, causing the BTC inflation rate to be 2.37% a year right now in BTC. With the Fed pegged to a 2% inflation they should be smacking BTC into the ground right now but we just saw elon musk make 200 Billion in 2020, and so we know its all fair game, SOMEONE is lying and BTC is exposing that.





