
I posted this to show the strength of the price at the moment: https://www.tradingview.com/chart/BTCUSD/oUyXIz6t-Things-are-looking-good-short-term/
I will lay out my plan for the charting this next few months. I use Market Cipher to get the feel for the money flow and strength of price movement. To trade confidently. I use trend vision to get my "trade zone" when it goes from green or red to yellow , that is when the trend is ready to change and give you a nice profit. On top of all that, I draw "spider lines" to give me some price targets when the price starts moving hard. This picture below will explain that in part.
The green and red dashed lines are the top and bottom average price over time, if it breaks through these lines over or under its a big deal, they are assumed to me to be very reliable average prices.
The blue dashed line is the average for price for this pump.
The blue and red lines are tops and bottoms for most everything 2018 and after
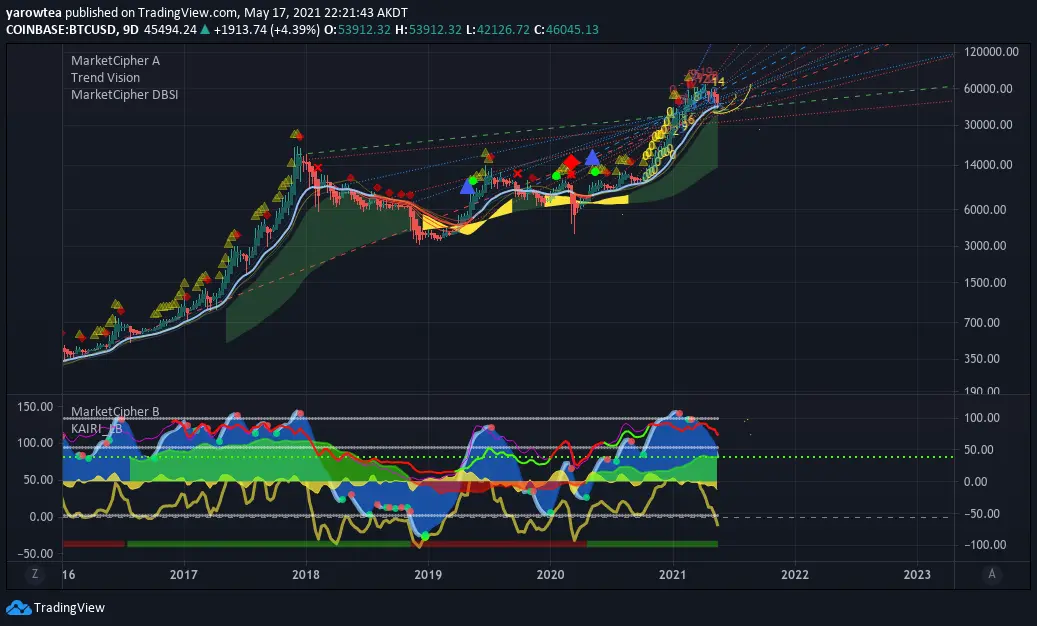
So what I will do is trade these spider lines with my tools and share that with you so we can all enjoy it. If you wish to learn how to draw spider lines watch this: https://www.youtube.com/watch?v=0dMAVCAheWE That is Crypto Face and he is exceptional at trading, he created the Market Cipher I use on trading view. Most of all the data I trade with is from that tool, and I will link the site that has tutorials if anyone wants to learn more or try it themselves.
On the 3 hour chart, the yellow circles are the blue tops and red bottoms to give me some charting to go with my trading indicators. We came close to the dashed red line which is a very solid price line since 2015. So up we go for now, to test that bottom.
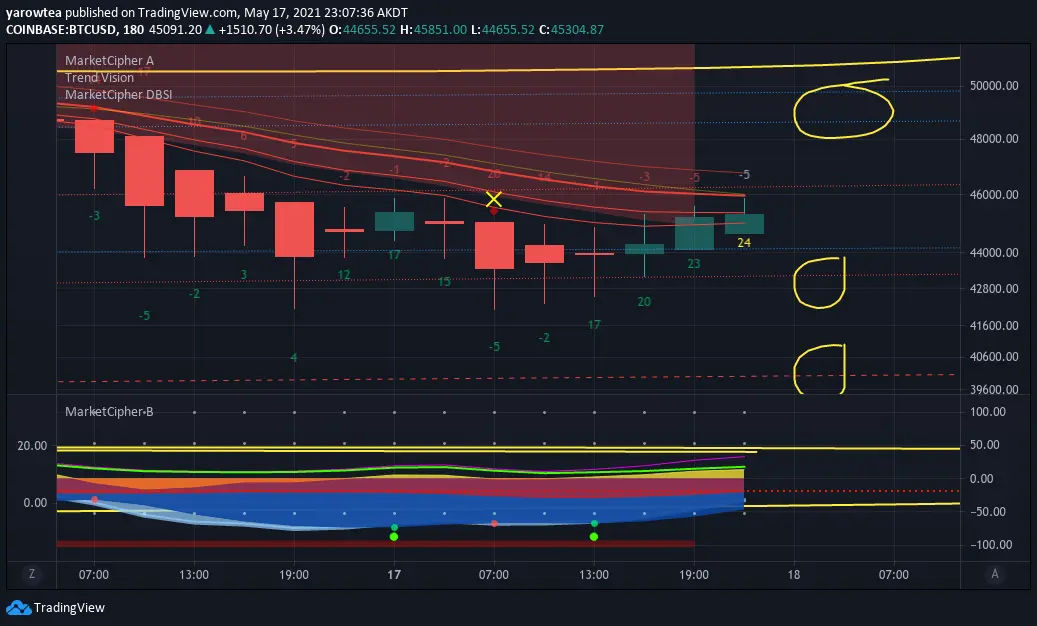
So with that in mind, I will break down what I see on the charts.
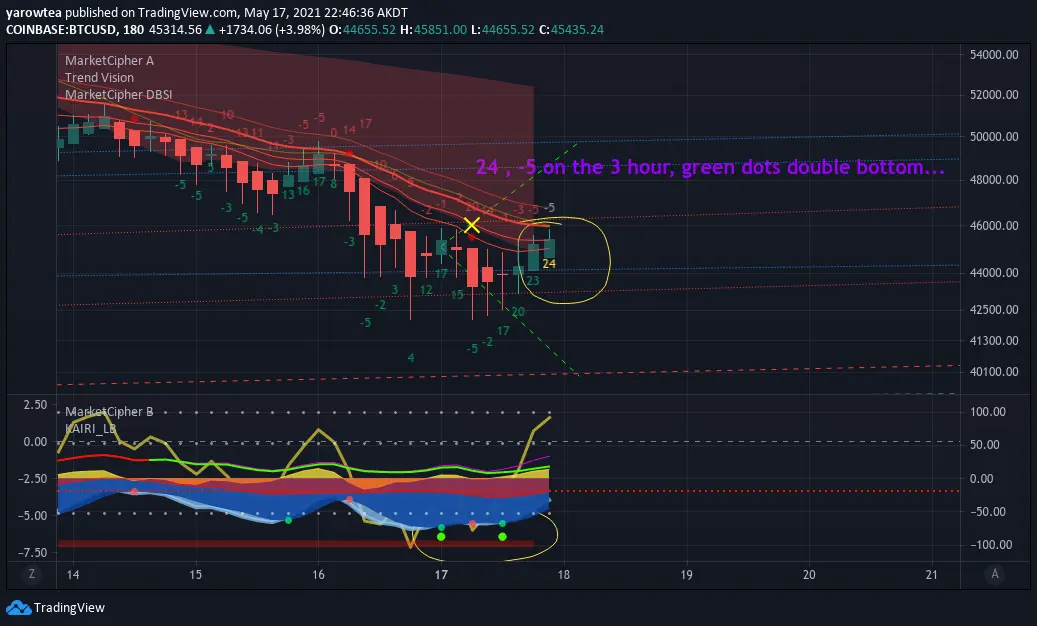
The 3 hour RSI is in the green, meaning buy zone, the bottom may be in for a bit, as I see on the 9 hour chart. 18 is a pretty good strength for 9 hour chart...
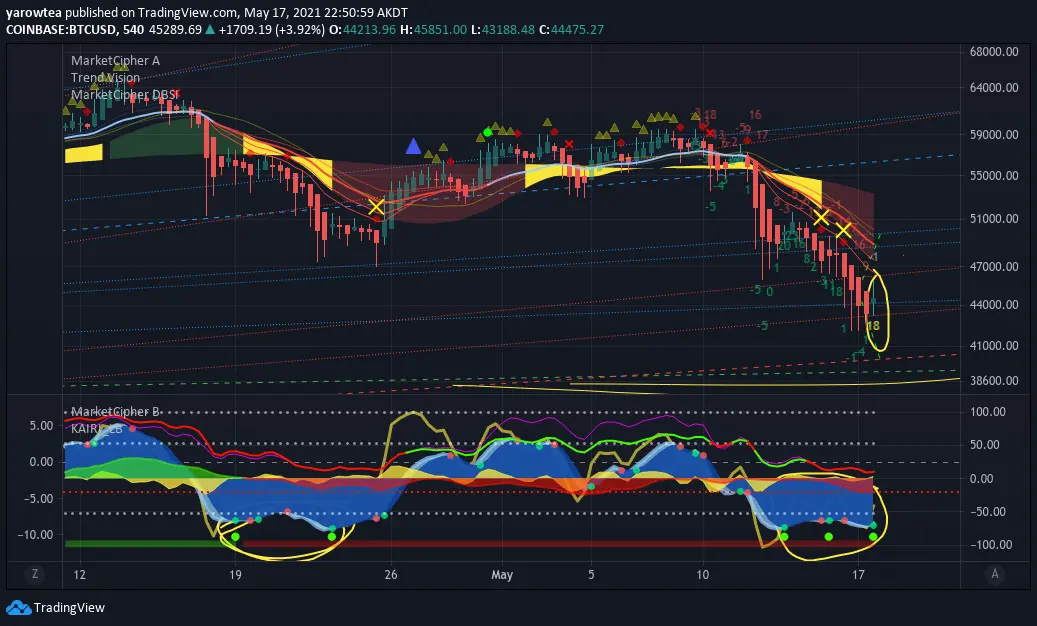
The 2 day chart though, it just lost its strength, and if that money flow at the bottom goes from green to red BTC will be dropping maybe quickly. Just keep that in mind the next week. What I will try to do is keep this updated so that we can all develop a feel for the daily price flow.
The miners have been selling more than they were last few months, its a factor. This thing can bottom out as they print more $$$.
Final thoughts are that: We are not out of the woods yet, we just got to the dangerous part, and have yet to experience any real pain yet, so be cautious, but short term it might recover for a few days...
Tutorials for Market Cipher can be found here: https://marketciphertrading.com?ref=2608
I will slowly give examples of how I read and use MC but, the videos are a great explanation beyond what I care to write, maybe one day...





