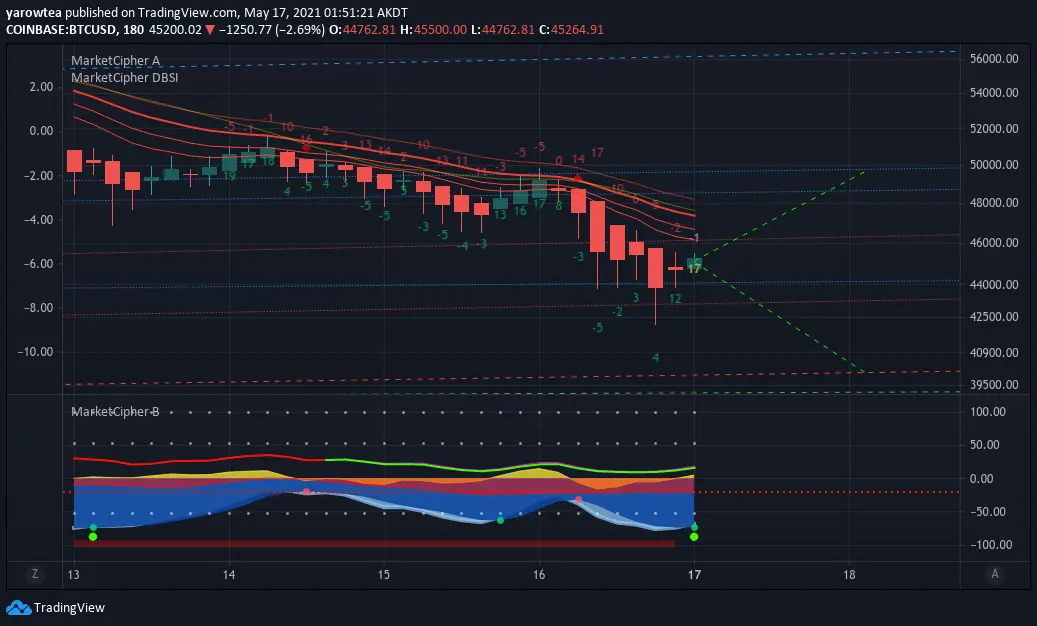
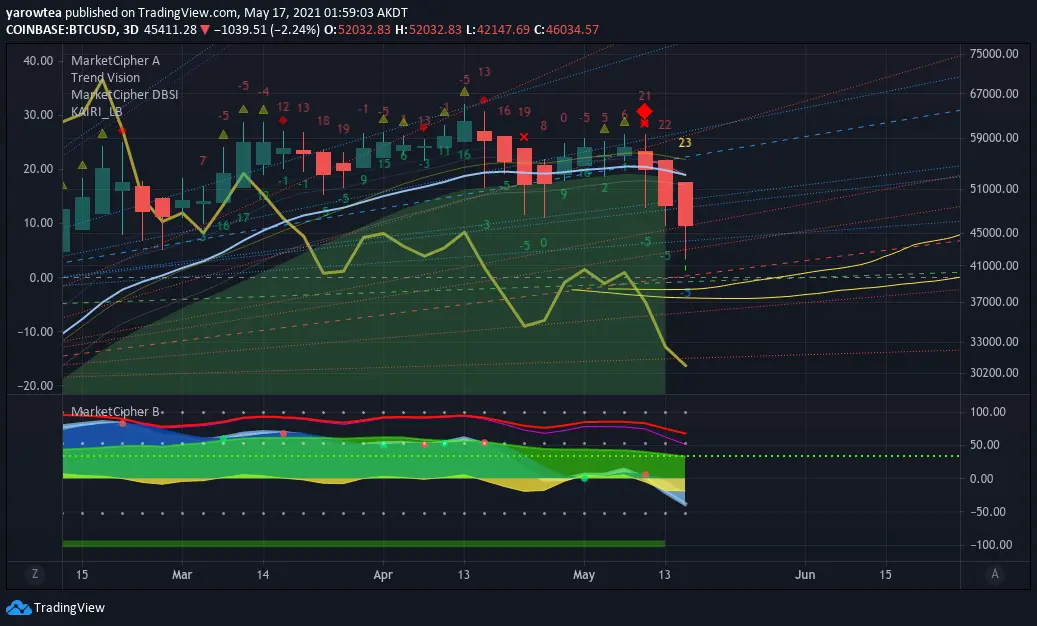
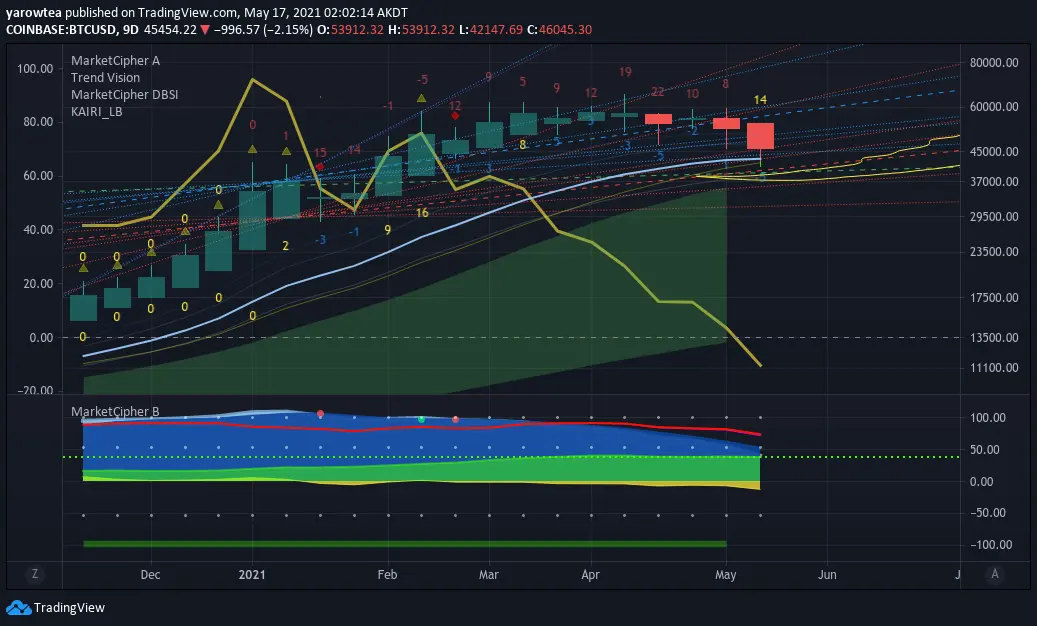
This is the 3 hour, 3 day and 9 day charts for BTC. I see gains on the 3 hour for about a day, and then we either go above 50k or head down as low as 38k for now.

This is the 3 hour, 3 day and 9 day charts for BTC. I see gains on the 3 hour for about a day, and then we either go above 50k or head down as low as 38k for now.
How do you rate this article?
0

Just sharing some chart analysis with the Market Cipher trading tool. If you want to learn more: https://marketciphertrading.com?ref=2608

Just to check the BTC price vs USD

Send a $0.01 microtip in crypto to the author, and earn yourself as you read!
% to author / 80% to me.
4 hours ago
4 minute read

3 hours ago
4 minute read

6 hours ago
5 minute read
Page not displaying correctly?


