This post examines SUSHI/USDT retail price and volume movement from Jan-01 to Feb-28.
Sushi saw strong, high-volume trading at the start of 2021.
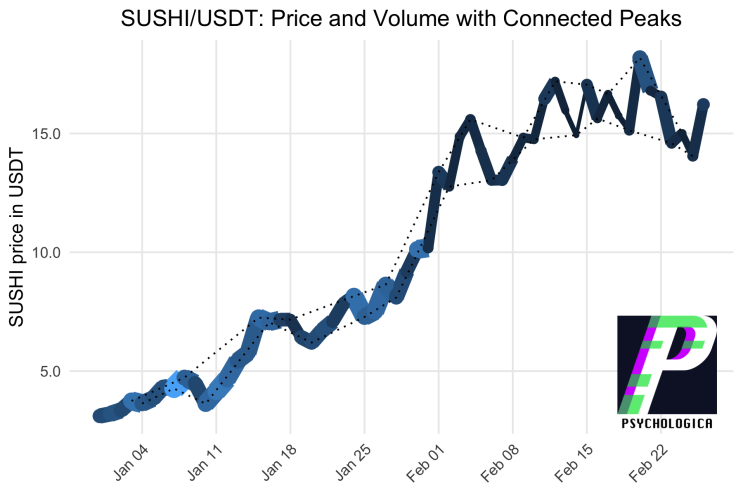
The SUSHI/USDT price started around 2.5 USDT and traded within a narrow channel, barely 1 USDT wide, for the full month of January.
Until the end of the second week in January, the SUSHI price remained beneath 5 USDT.
SUSHI saw a brief markup to 7.5 USDT in the third week, then traded sideways again within a narrow channel until the end of the month.
SUSHI closed January at just about 10 USDT - and a decent volume was still trading at this price.
There was substantially less SUSHI/USDT volume in February, with the notable exception of trading around February 20.
After rapidly reaching 15 USDT, the price began to oscillate within a much larger range for the rest of the month - approximately 3 USDT wide now.
By the second week in February, the 15 USDT price point switched from resistance to support. Subsequently, the price has largely remained above 15 USDT.
In the third week of February, we see large volume trading around 18 USDT, which finally brought the price just below 15 USDT.
February closed with moderate volume bringing SUSHI above 15 USDT again.
How to read this plot
This plot depicts the movement of SUSHI quoted in USDT, for the year 2021 to date. Data for SUSHI/USDT were collected from Huobi.
The width of the line is proportional to the volume traded during that period. Similarly, lighter colors correspond to higher volume.
The peaks and troughs have been identified. Peaks were connected to form channels containing most of the price action.
About Psychologica
People make the market. Psychologica publishes original research about people and markets.
This is not financial advice.
More Research from Psychologica
- Comparing UNI and SUSHI in the Ethereum Economy
- UNI/USD Retail Market Structure
- Comparing ADA and DOT in the Ethereum Economy
- BTC and ETH animated against USD
Questions and Comments
I look forward to your questions and comments


