This post examines how UNI and SUSHI traded against ETH so far in 2021.
First we'll review the retail market structure of UNI/ETH and SUSHI/ETH. Next, we'll look at daily returns for UNI/ETH and SUSHI/ETH. Finally, we'll examine the correlation of these returns over time.
Psychologica’s Ethereum Economy series examines markets traded in ETH instead of USD.
UNI/ETH Retail Market Structure
2021 began with UNI falling against ETH. By the second week in January, UNI was trading around 0.005 ETH.
Moderate volume in the third week of January started driving the price up to 0.0075 ETH. There was particularly high volume at about 0.011 ETH on January 28.
January closed with a surge in volume that drove UNI to nearly 0.015 ETH.
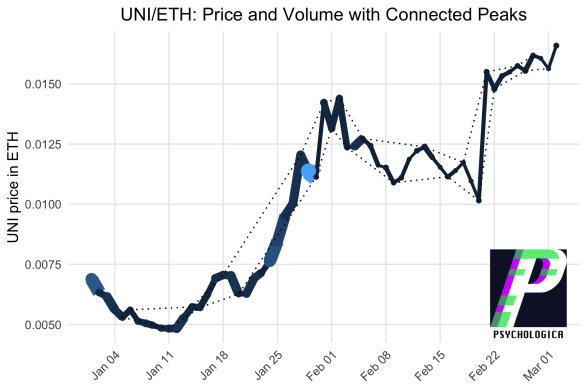
February generally saw less volume in the UNI/ETH market than January.
In the first three weeks of February, UNI ranged in a channel approximately 0.003 ETH wide as the UNI price fell to 0.01 ETH.
In the third week of February, UNI jumped above 0.015 ETH - although this was driven by fairly low volume.
February closed with UNI ranging gradually upwards in a narrow channel, finishing at about 0.016 ETH.
SUSHI/ETH Retail Market Structure
SUSHI started 2021 with high-volume selling that ultimately drove the price to its quarterly minimum so far.
In the second week of January, volume dropped off slightly but the ETH price started to increase.
By the third week in January, SUSHI was trading above 0.005 ETH. There was substantial volume trading at about 0.0055 ETH on January 24.
SUSHI subsequently traded between 0.005 ETH and 0.006 ETH until the end of January.
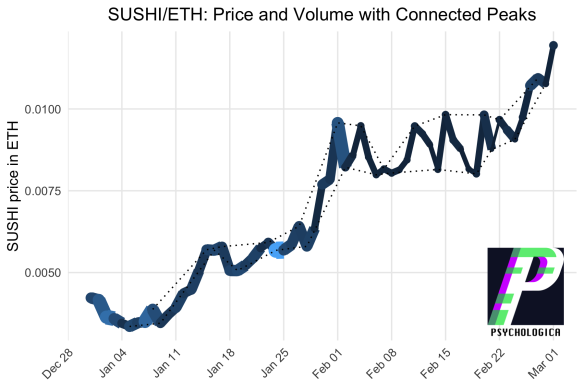
SUSHI entered February with a low-volume drive above 0.009 ETH, which was met with a substantial volume of selling that ultimately brought the price back around 0.008 ETH.
Through the first, second, and third weeks of February, SUSHI oscillated within a relatively wide channel bounded at 0.008 ETH and 0.010 ETH.
In the final week of February, SUSHI broke above 0.01 ETH with fairly low volume, ultimately ending substantially up against ETH.
Daily Percent Change
The daily percent change of an asset is computed by comparing yesterday's closing price to today's closing price. When the average percent change is positive, it means the base asset (UNI and SUSHI) is gaining on the quote asset (ETH). We have calculated the percent change for UNI/ETH and SUSHI/ETH, which are plotted here.
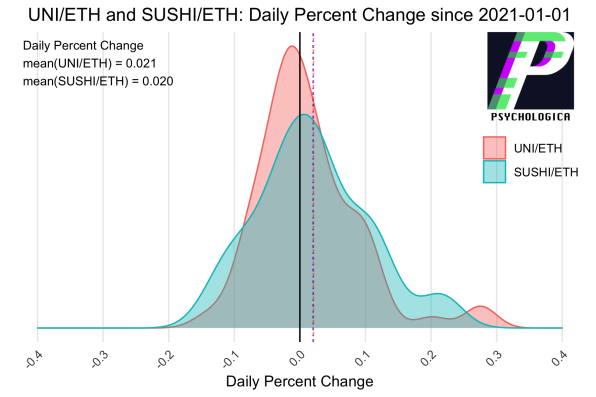
The average daily percent change for UNI/ETH is 0.021, while the average daily percent change for SUSHI/ETH is 0.020. Both these assets gained on ETH during 2021. Because the average for UNI is slightly higher, it appears UNI gained more on ETH than SUSHI.
These distributions appear to be approximately Gaussian - with the notable exception that both UNI/ETH and SUSHI/ETH have had several days with unexpected gains. If the distribution were symmetrical and distributed around an average of 0, then we wouldn't expect so many values above 0.2. These unusually high gains drag the averages up substantially.
Correlation of Daily Percent Change
The correlation of Asset Returns indicates whether asset prices change together. When correlation is a high positive number, then the assets are both going in the same direction at the same time.
We calculated a 7-day moving correlation between the returns of UNI/ETH and SUSHI/ETH. Base asset returns are plotted as bars, while the correlation is plotted as a black line.

In general, the correlation tends to be positive, ranging between 0.25 and 0.75. This pattern is substantially interrupted in January, then interrupted again in the third week of February. However, there are also weeks during which there is a consistent correlation of daily changes.
Altogether, UNI/ETH and SUSHI/ETH don't appear to exhibit any systematic pattern of correlation. Nevertheless, the correlation between UNI/ETH and SUSHI/ETH is frequently positive, which is an indication that market participants might treat these assets similarly sometimes.
Conclusion
Both UNI and SUSHI gained on ETH in the start of 2021. These assets saw substantial trading volume throughout January, followed by lower-volume price gains in February.
So far in 2021, both UNI and ETH exhibited a positive average percent change against ETH.
Finally, UNI/ETH and SUSHI/ETH returns do not exhibit a stable 7-day moving correlation but there is some indication that these assets tend to move together.
About Psychologica
People make the market. Psychologica publishes original research about people and markets.
This is not financial advice.
More Research from Psychologica
- SUSHI/USD Retail Market Structure
- UNI/USD Retail Market Structure
- Comparing ADA and DOT in the Ethereum Economy
- BTC and ETH animated against USD
Questions and Comments
I look forward to your questions and comments


