This post examines BNB/USD retail price and volume movement from Jan-01 to Mar-08.
Over the course of January and February, the price action of BNB/USD was so extraordinary that we'll need to analyze it a little differently than usual.
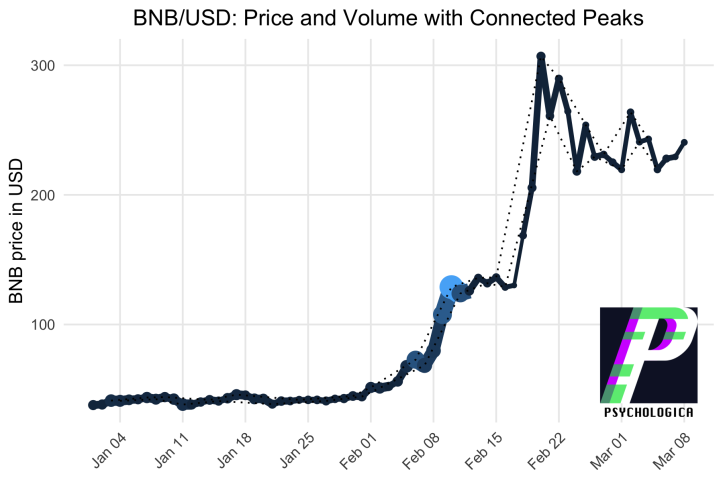
BNB was trading at 40 USD going into January 2021 and generally stayed below 50 USD until the end of the month.
Going into February, BNB first gained a little on moderate volume, then rose above 100 USD on substantial volume by the end of the first week.
In the second week of February, extremely high volume pushed the price to around 130 USD.
The price exploded in the third week, rising above 200 USD on weak volume - then above 300 USD on slightly higher volume.
The final week in February saw the price retreat a little to 225 USD.
In March, the price has generally stayed above 225 USD, while fluctuating within a price channel of about 30 USD.
Changes in Price Scale
Since BNB/USD increased 6x during this period, January appears "squished" compared to February. However, equivalent percent changes will look bigger as an asset appreciates. We therefore use the logarithm to correct for distortions caused by the price being multiplied 6x during this time period.
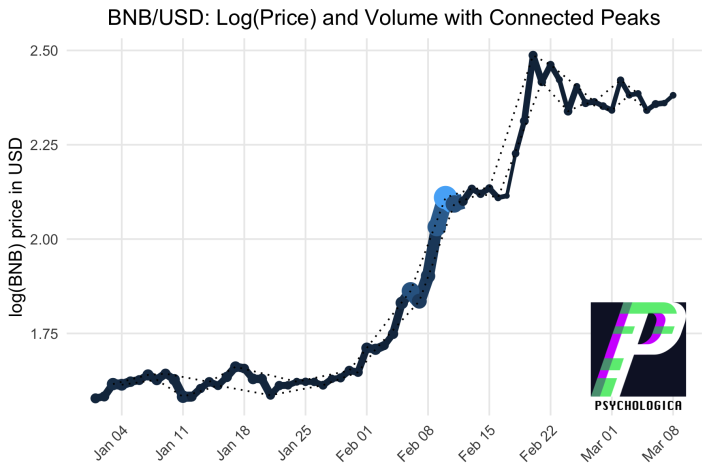
Tip: Mathematically, the logarithm converts a multiplicative process into an additive process. The logarithm enables us to examine BNB's exponential growth as a linear process.
The log transformed prices enable early January to be more comparable with late February despite there being a 6x difference in prices.
We can now see that the price gain starting February 6 was of a similar percentage change as that which occurred on February 17.
However, the volume traded during the early February markup is substantially higher than the volume traded at the end of February.
The width of the price channel, compared in percentage terms, is relatively stable across the entire time period.
Ultimately, although it looks like the price was stable in January but fluctuated wildly in February, in fact the percent change remained relatively stable across this time period.
How to read this plot
This plot depicts the movement of BNB quoted in USD, for the year 2021 to date. Data for BNB/USD were collected from FTX.
The width of the line is proportional to the volume traded during that period. Similarly, lighter colors correspond to higher volume.
The peaks and troughs have been identified. Peaks were connected to form channels containing most of the price action.
About Psychologica
People make the market. Psychologica publishes original research about people and markets.
This is not financial advice.
More Research from Psychologica
- MKR/USDT Retail Market Structure: Q1 2021 so far
- AAVE/USD Retail Market Structure: Q1 2021 so far
- SNX/USD Retail Market Structure: Q1 2021 so far
- Comparing UNI and SUSHI in the Ethereum Economy
- Comparing ADA and DOT in the Ethereum Economy
- BTC and ETH animated against USD
Questions and Comments
I look forward to your questions and comments.


