This post examines AAVE/USD retail price and volume movement from Jan-01 to Mar-03.
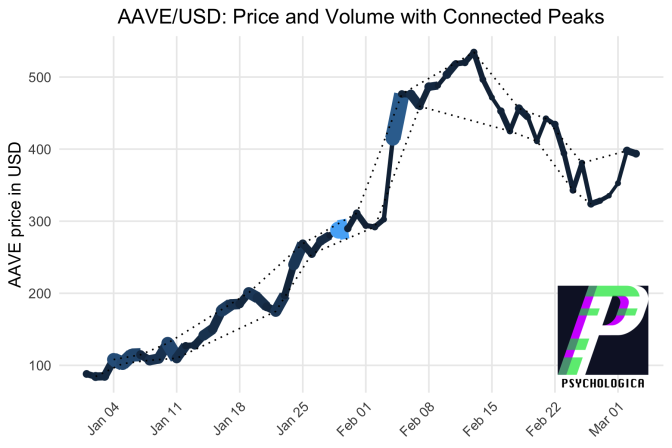
AAVE started 2021 below 100 USD but in the first week of the year, managed to just barely exceed 100 USD.
Moderate volume drove the price sideways for a week.
In the third week of January, slim volume raised the AAVE price to 200 USD.
January closed with substantial trading on January 29 that eventually pushed the AAVE price above 300 USD.
February opened with AAVE rocketing above 400 USD on low volume, then going even farther with some substantial trading between 400-475 USD.
Low-volume trading in the second week of February brought the price above 500 USD, where it peaked around 525 USD.
AAVE has retraced in the third and fourth weeks of February, trading downwards with low volume in a price channel approximately 50 USD wide.
In the final week of February, the price bottomed out above 300 USD and is currently trading at 400 USD.
How to read this plot
This plot depicts the movement of AAVE quoted in USD, for the year 2021 to date. Data for AAVE/USD were collected from Kraken.
The width of the line is proportional to the volume traded during that period. Similarly, lighter colors correspond to higher volume.
The peaks and troughs have been identified. Peaks were connected to form channels containing most of the price action.
About Psychologica
People make the market. Psychologica publishes original research about people and markets.
This is not financial advice.
More Research from Psychologica
- SNX/USD Retail Market Structure: Q1 2021 so far
- Comparing UNI and SUSHI in the Ethereum Economy
- Comparing ADA and DOT in the Ethereum Economy
- BTC and ETH animated against USD
Questions and Comments
I look forward to your questions and comments.


