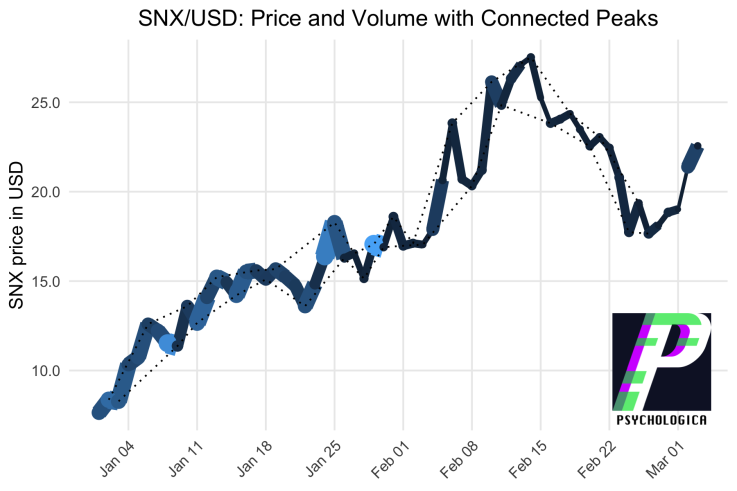
This post examines SNX/USD retail price and volume movement from Jan-01 to Mar-03.
SNX started strong in 2021 with substantial volume pushing the price from about 5 USD to 10 USD in the first week of January.
Buying continued into the second week, with additional trading around the 11.5 USD level, to close the week around 13 USD.
SNX ranged within a 1 USD channel in the third week of January, then tested the lower bound of the channel on January 23 and the upper bound on January 25.
January closed with substantial volume trading around 17 USD.
Volume in February was lower than January. In the first week, moderate buying brought SNX above 20 USD, then low volume pushed it above 23 USD before pulling back to 20 USD.
Another low-volume push in the second week brought SNX above 25 USD, where it ultimately peaked above 26 USD.
The third week in February saw a low-volume retreat to 23 USD, followed by another drop to 17.5 USD in the last week of February.
February closed with low volume trading around 18 USD.
March is off to a strong start with moderate volume trading above 21 USD.
How to read this plot
This plot depicts the movement of SNX quoted in USD, for the year 2021 to date. Data for SNX/USD were collected from Kraken.
The width of the line is proportional to the volume traded during that period. Similarly, lighter colors correspond to higher volume.
The peaks and troughs have been identified. Peaks were connected to form channels containing most of the price action.
About Psychologica
People make the market. Psychologica publishes original research about people and markets.
This is not financial advice.
More Research from Psychologica
- Comparing UNI and SUSHI in the Ethereum Economy
- Comparing ADA and DOT in the Ethereum Economy
- BTC and ETH animated against USD
Questions and Comments
I look forward to your questions and comments.


