For most of the past year, Bitcoin bulls have enjoyed the luxury of buying every dip and watching price recover. Right now, that narrative is being challenged. Looking at the higher timeframes, Bitcoin appears to be losing momentum, key support levels have already failed, and sellers are beginning to take control of the market structure.
This does not guarantee that Bitcoin is heading to $45,000, but the technical evidence suggests that the risk of another significant leg lower remains very real.
Weekly Chart: Failed Breakout Above $86,000
The biggest warning sign comes from the weekly timeframe.
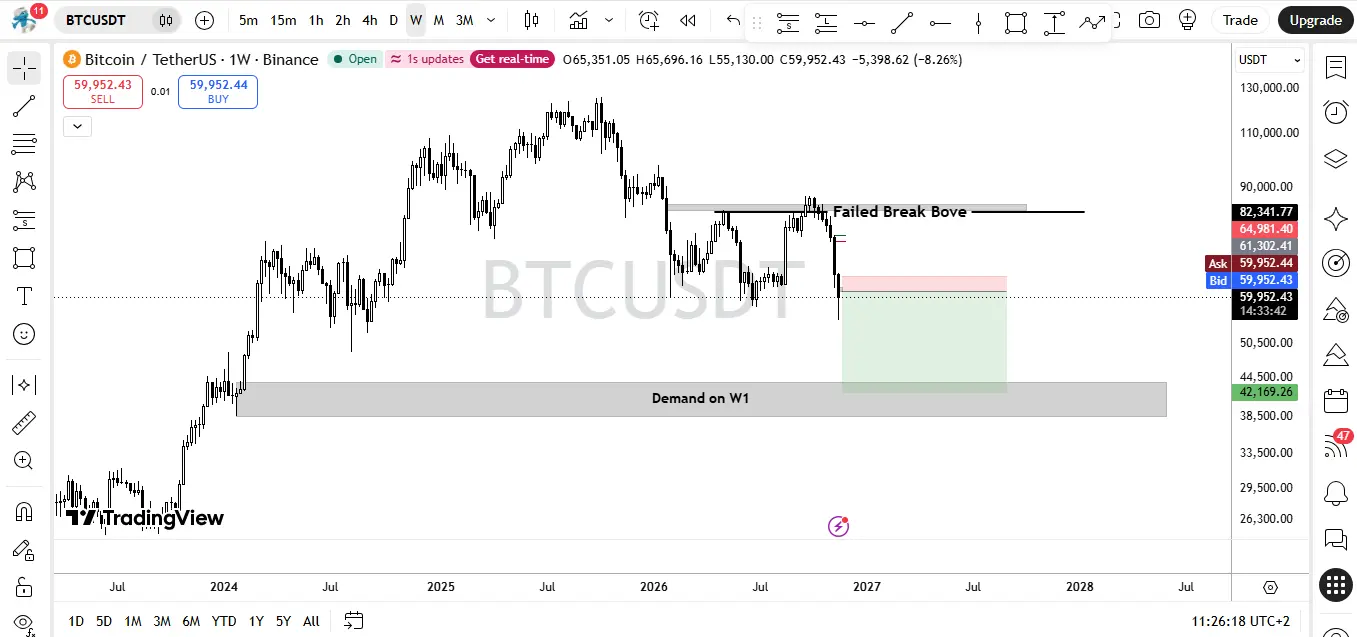
Bitcoin managed to break above the $86,000 resistance zone, a level many traders were watching as confirmation of renewed bullish strength. However, instead of building support above that area, price performed multiple retests and repeatedly failed to secure a convincing weekly close above resistance.
The market attempted another push, reaching roughly $87,000, but once again buyers were unable to maintain control.
When a breakout cannot hold, it often becomes a trap.
What followed was a sharp rejection that sent Bitcoin tumbling from the highs and back toward the low $55,500 region. Price is now sitting around $61,000, well below the failed breakout area.
From a market structure perspective, the weekly chart now suggests that Bitcoin may be preparing to revisit the large demand zone lower on the chart. That area begins around the mid-$40,000 range, making $45,000 a realistic downside target if current weakness continues.
The higher timeframe story is simple: resistance held, buyers failed, and the market is now searching for support.
Daily Chart: Demand at $62,800 Has Been Lost
Dropping down to the daily timeframe makes the bearish case even clearer.
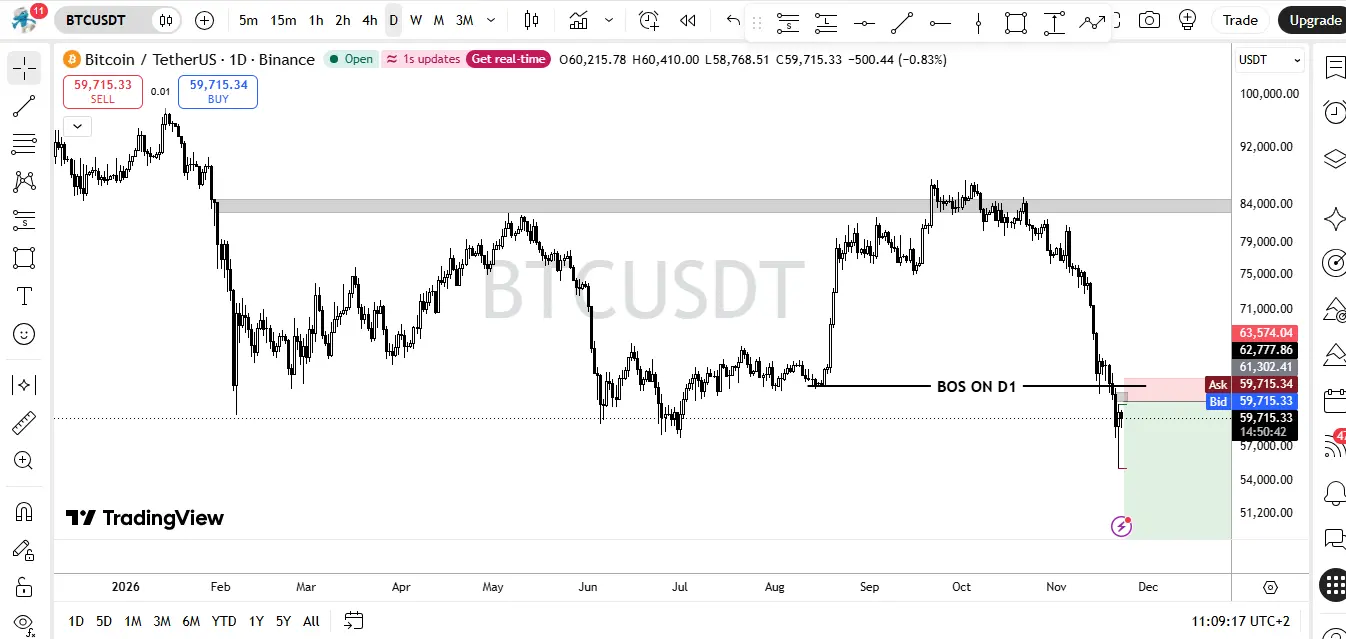
For weeks, the $62,800 demand zone acted as a critical line in the sand. As long as buyers defended that level, there was always a possibility of a recovery.
That support has now been breached.
Price did not merely test the level. It traded directly through the demand zone and is currently holding below it. In technical analysis, broken support often turns into new resistance, and that is exactly what traders should be watching.
The area between $62,000 and $66,000 now becomes a potential selling region.
A bearish approach would be to wait for price to retrace back into this resistance zone rather than chasing the market lower. Selling into retracements generally offers better risk management than entering after an extended drop.
The key invalidation point remains above $66,000. If Bitcoin can reclaim and hold above that level, the bearish structure begins to weaken.
Until then, sellers retain the advantage.
Hourly Chart: Liquidity Draw Around November 20 Selling Zone
On the one-hour chart, there is still the possibility of a short-term retracement before the next move lower.
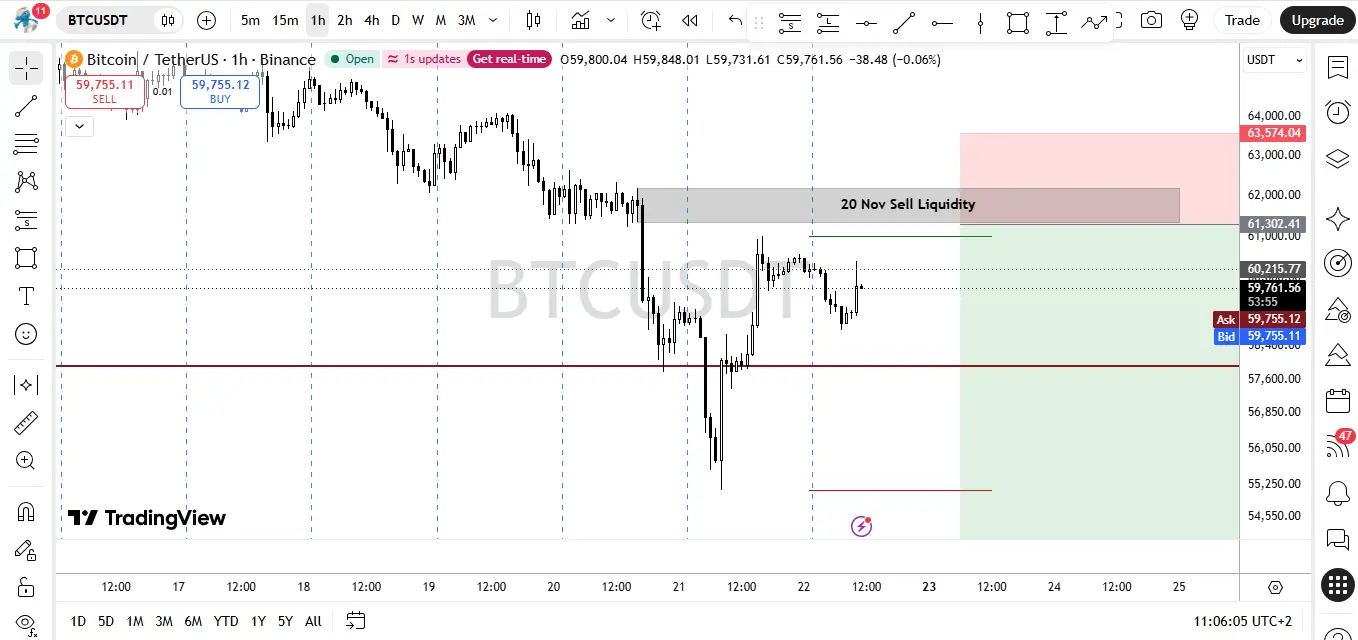
Price is trading beneath a notable area of previous selling liquidity that formed around November 20. Markets often revisit these zones before deciding on the next directional move.
A push back into the $61,000 to $62,000 region would not be surprising.
In fact, such a move could provide exactly the setup many traders are waiting for.
The signal to watch is a bearish engulfing candle forming inside that zone. If buyers push price higher into resistance only to be aggressively overwhelmed by sellers, it would strengthen the case for another decline.
The higher timeframe trend remains bearish, so any rally into resistance should be treated cautiously until proven otherwise.
Why New Buyers May Not Be Appearing
Technical analysis only tells part of the story.
The broader market environment remains uncertain. Global financial markets continue to face concerns around economic growth, interest rates, and risk appetite. During periods of uncertainty, fresh money often becomes reluctant to chase volatile assets.
Bitcoin needs liquidity to sustain meaningful rallies.
At the moment, there is an argument that new liquidity simply is not entering the market at the pace required to push prices back toward all-time highs.
Long-term holders continue defending positions. Traders who bought much lower remain profitable. However, for prices to move significantly higher, new buyers must absorb supply from existing holders who want to take profits.
Without that fresh demand, rallies can quickly run out of fuel.
Stablecoin Liquidity Is Also Worth Watching
Another factor worth monitoring is stablecoin circulation.
Historically, stablecoins such as USDT and USDC have acted as an important source of liquidity within the cryptocurrency ecosystem. When stablecoin supply expands, more capital is available to move into digital assets.
Recently, market participants have pointed to reductions in circulating supply through stablecoin redemptions and token burns. This has sparked concerns that liquidity may be leaving parts of the crypto market.
In previous market cycles, capital often rotated from Bitcoin into stablecoins while remaining inside the cryptocurrency ecosystem. The concern among some traders now is that money may not simply be rotating into stablecoins but may instead be exiting digital assets altogether and moving back into traditional fiat markets.
If that trend continues, it could create additional pressure on risk assets, including Bitcoin.
Final Thoughts
Bitcoin's technical picture has deteriorated considerably.
The weekly chart shows a failed breakout above $86,000 and repeated rejection around $87,000. The daily chart confirms a loss of the crucial $62,800 demand zone, while the hourly chart suggests any retracement toward the $61,000 to $62,000 area could become an opportunity for sellers to step back in.
As long as price remains below $66,000, the path of least resistance appears to be lower.
A move toward the $45,000 weekly demand zone is becoming increasingly plausible, especially if liquidity continues to leave the market and buyers fail to reclaim key resistance levels.
For now, patience may be the most valuable position a trader can hold. Chasing price in either direction rarely ends well. Waiting for confirmation, respecting risk, and letting the market reveal its next move remains the smartest approach.
This article reflects my market opinion based on chart analysis and should not be considered financial advice.