Spend enough time studying markets, and you start to notice that every major move follows a familiar pattern. The assets change, the headlines change, and the emotions change, but the underlying battle remains the same: buyers versus sellers.
Looking at Bitcoin's weekly chart over the past few years, that battle becomes remarkably clear.
What began as a period of despair following the 2022 bear market gradually evolved into one of the most significant rallies in Bitcoin's history. Now, after reaching six-figure prices, the market appears to be revisiting a critical area where demand and supply are once again being tested.
When Nobody Wanted Bitcoin
The most interesting buying opportunities rarely arrive when everyone is excited.
Back in late 2022 and early 2023, Bitcoin was trading near the lows. Confidence had been shattered. Many investors had lost money, media sentiment was overwhelmingly negative, and predictions of even lower prices were common.
Yet beneath the surface, something important was happening.
While public interest had faded, buyers were quietly accumulating. Every time sellers pushed the market lower, demand appeared and absorbed the available supply. Price stopped collapsing and began moving sideways.
This is how many major trends begin. Not with excitement, but with exhaustion.
The sellers eventually run out of coins they are willing to sell at those prices, while patient buyers steadily build positions.
Demand Begins to Dominate
As selling pressure weakened, demand started gaining the upper hand.
Bitcoin slowly climbed higher, breaking through previous resistance levels. What initially looked like a small recovery started attracting attention. Traders returned. Institutions increased exposure. New capital entered the market.
The relationship between supply and demand began shifting dramatically.
There were simply more buyers chasing Bitcoin than there were willing sellers.
That imbalance pushed prices higher and higher.
Each breakout created confidence. Each rally attracted fresh demand. Each new high generated headlines that brought even more participants into the market.
What followed was a textbook expansion phase.
The Expansion That Captured Attention
Once Bitcoin cleared major resistance levels, momentum accelerated.
The market moved from cautious optimism to widespread enthusiasm. FOMO became a powerful force. Investors who had ignored Bitcoin at lower prices suddenly wanted exposure after substantial gains had already occurred.
This is often how expansion phases work.
Rising prices create demand. Demand creates further price increases. Those higher prices attract even more demand.
For a period of time, the market becomes a self-reinforcing cycle.
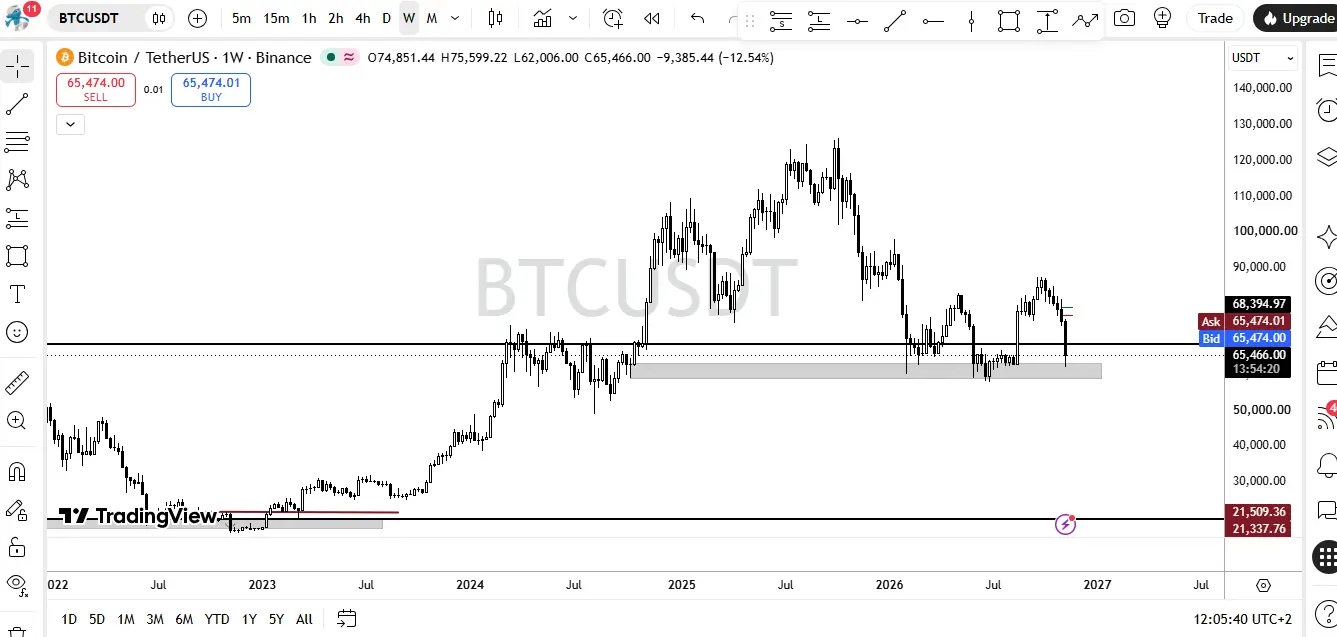
The chart shows this clearly as Bitcoin surged from the accumulation zone into territory that many thought impossible just a few years earlier. By the time Bitcoin pushed well beyond previous all-time highs and into the six-figure range, demand was overwhelming supply.
But every strong trend eventually attracts something else.
Profit-taking.
Distribution: The Quiet Transfer of Coins
The higher the market rises, the more tempting it becomes for early buyers to lock in gains.
This doesn't typically happen all at once. Distribution is usually a process rather than an event.
Near the highs, Bitcoin continued making impressive moves, but subtle changes started appearing on the chart. Volatility increased. Sharp rallies were followed by equally sharp pullbacks. Price swings became larger and more erratic.
While enthusiastic buyers continued entering the market, long-term holders and larger participants had an opportunity to sell into that strength.
In simple terms, coins were changing hands.
The buyers believed the rally would continue indefinitely. The sellers were happy to provide liquidity at significantly higher prices than where they had accumulated.
For a while, demand was strong enough to absorb that supply.
Eventually, however, the balance began to change.
Supply Starts Fighting Back
Markets rise when demand exceeds supply.
Markets fall when supply exceeds demand.
It sounds simplistic, but almost every chart can be explained through that basic principle.
After Bitcoin reached its peak region, sellers became increasingly aggressive. The market could no longer maintain the same upward momentum that had characterized the expansion phase.
Rallies became shorter.
Pullbacks became deeper.
Confidence started fading.
That doesn't necessarily mean the entire bull market is over, but it does indicate that supply has become a much more important factor than it was during the advance.
Why This Zone Matters
The area highlighted on the chart around the mid-$60,000 range is significant because it represents a region where buyers previously showed substantial interest.
Markets have a tendency to revisit important zones.
What was once resistance often becomes support. Areas where major buying took place tend to attract attention again because traders remember them.
Now Bitcoin has returned to one of those areas.
The market is effectively asking a simple question:
Is there still enough demand here to absorb the available supply?
If buyers step in aggressively, history may view this region as a healthy retest of a major breakout level.
If sellers remain in control, the market may need more time before a new expansion phase can begin.
The Market Cycle Repeats
What makes this chart fascinating is that it tells the same story that financial markets have told for centuries.
First comes accumulation.
Then comes expansion.
Then comes distribution.
Then comes a period where supply and demand seek balance once again.
Bitcoin is not immune to these cycles. In fact, the chart provides one of the clearest examples of how they develop in real time.
The rally from the lows happened because demand consistently absorbed supply. The move to record highs happened because demand eventually exceeded supply by a wide margin. The current pullback reflects a market where supply has re-entered the equation and buyers must prove themselves again.
Final Thoughts
Every candlestick on this chart represents thousands of decisions made by buyers and sellers. Strip away the headlines, narratives, and emotions, and what remains is a simple economic reality.
Price moves because of supply and demand.
Bitcoin's rise from the 2022 lows showed what happens when demand steadily grows while available supply becomes scarce. The rally toward six figures reflected a period of expansion where buyers were willing to pay increasingly higher prices. The weakness that followed suggests a period of distribution and profit-taking.
Now the market stands at an important crossroads.
The coming months may reveal whether this current zone becomes the foundation for another major advance or whether additional supply still needs to be absorbed first.
Either way, the chart serves as a reminder that markets are ultimately driven by one timeless question:
Who is more motivated right now: the buyer or the seller?