
Hello Crypto Friends!
Thought i would do a quick update on these two.
Firstly BTC. -
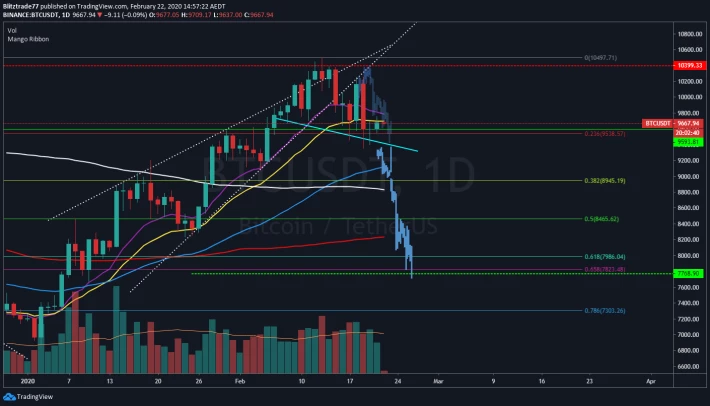
On the daily. BTC has lost it's 21 EMA, but supported by the .236 fib for now.
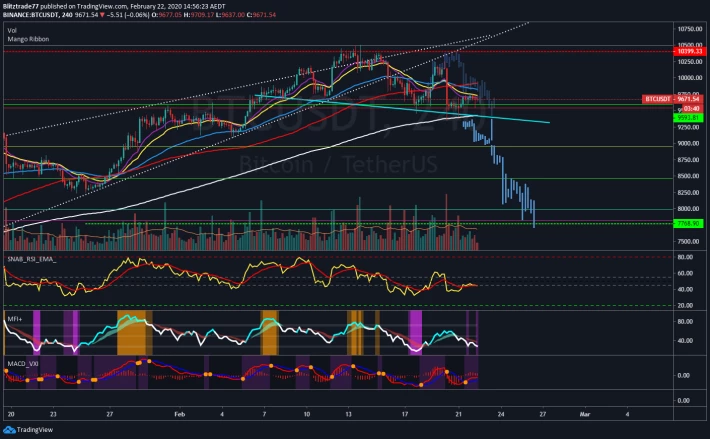
On the 4 hr, has lost all fast moving averages but supported by the 200 MA. As predicted, it is creating a neckline. I don't think there is much time left before it drops again.
Firstly the Daily 55 EMA is at around $9120, then the 200 MA (which has a downwards slope - this is bearish btw) coming in at around $8850 and smack bang in the middle of them is the .382 fib at $8950.
So there is a nice range there for BTC to bounce around off supports!
A Head and shoulders pattern normally breaks the neckline with a decent amount of volume and momentum.
Of course this is BTC we are talking about and this could be a massive trap, It would not surprise me if it suddenly took off back up to $10,500.
Next Chainlink-
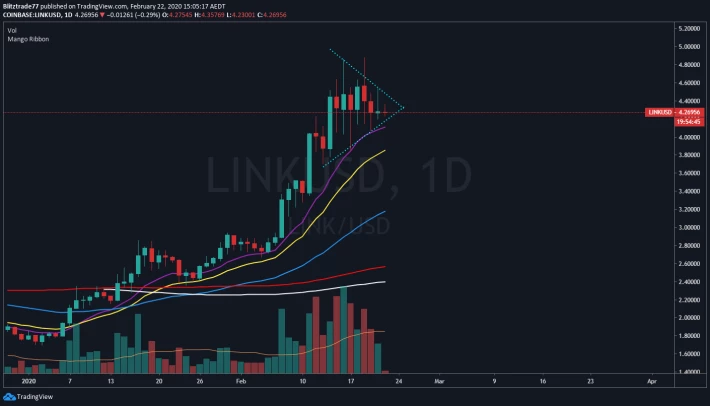
Chainlink on the daily, is in a symmetrical triangle, because this triangle has formed from a nice upwards run, it would normally have a high probability of breaking upwards.
However, It has double topped, it has not tested the 21 EMA in a long time and if BTC breaks down, i expect Chainlink to go down with it.
On the 4 hr-
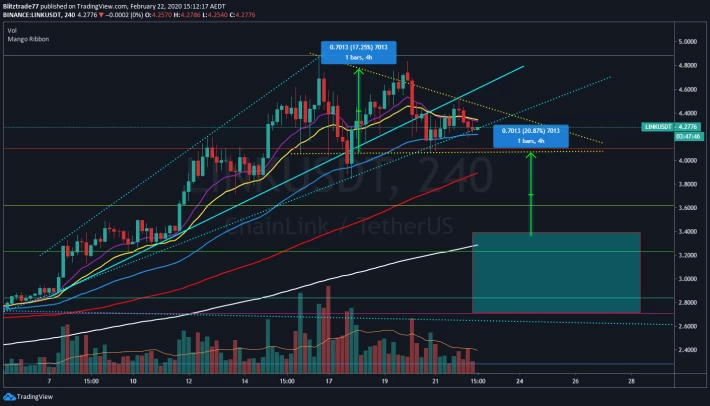
My apologies for the messy chart!
But there is alot going on here. Firstly the old trend line was lost. but a new trend line has been giving support (dotted line).
The pattern was an ascending broadening wedge, which is bearish when it breaks the trend line.
Also the yellow lines have marked out a descending triangle (or Head and Shoulders).
Also the 13 EMA and 21 EMA are above price and have crossed, which tells us price is being pushed down.
The measured move off both these patterns, puts chainlink at the 4hr 200 MA. Which is a great place for a retracement, correction. I would expect that to reset Chainlink and it should be able to carry on with it's upward move.
Hope this helps!
Happy Trading!





