
 As long as the leading cryptocurrency trades above $100,000, optimism remains in the market. Potential resistance levels for the “bull” phase are roughly estimated between $140,000 and $200,000, suggested CoinDesk analyst Omkar Godbole.
“One way to identify such levels is to use trend lines. They connect key lows and highs on the chart, showing the direction of movement and helping to identify support and resistance zones,” the expert explained.
He proposed drawing a line through the peaks of the growth phases in 2017 and 2021 — around $20,000 and $70,000 respectively. This way, “it is possible to identify a potential zone where selling pressure may arise,” Godbole explained.
At the time of writing, the trend line points to resistance around $115,300: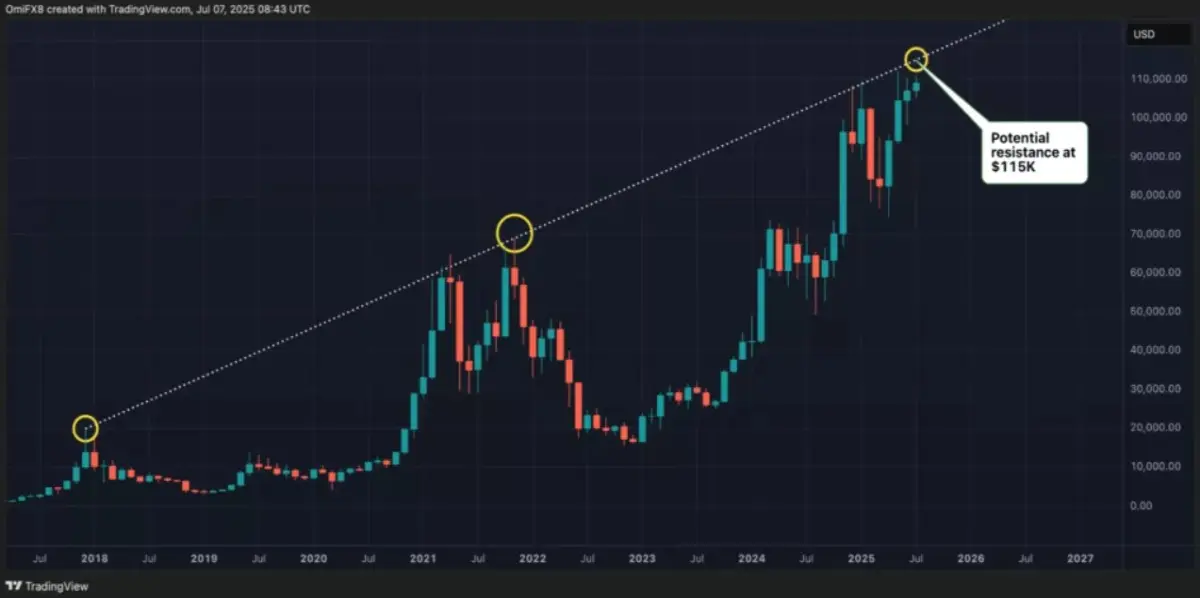
Monthly Bitcoin price chart on a linear scale. Data: CoinDesk, TradingView.
The same diagonal limited growth in December and January. During the April correction, the price dropped to $75,000.
“Logarithmic” resistance at $220,000
Godbole emphasized that the chart above is linear.
“It reflects absolute price changes and is better suited for assessing short-term trends,” the expert noted.
According to him, resistance levels in this representation may be less precise. Such a chart does not smooth out significant price fluctuations as a logarithmic chart does. The latter allows for more accurate drawing of trend lines and identification of key resistance zones, Godbole is confident.
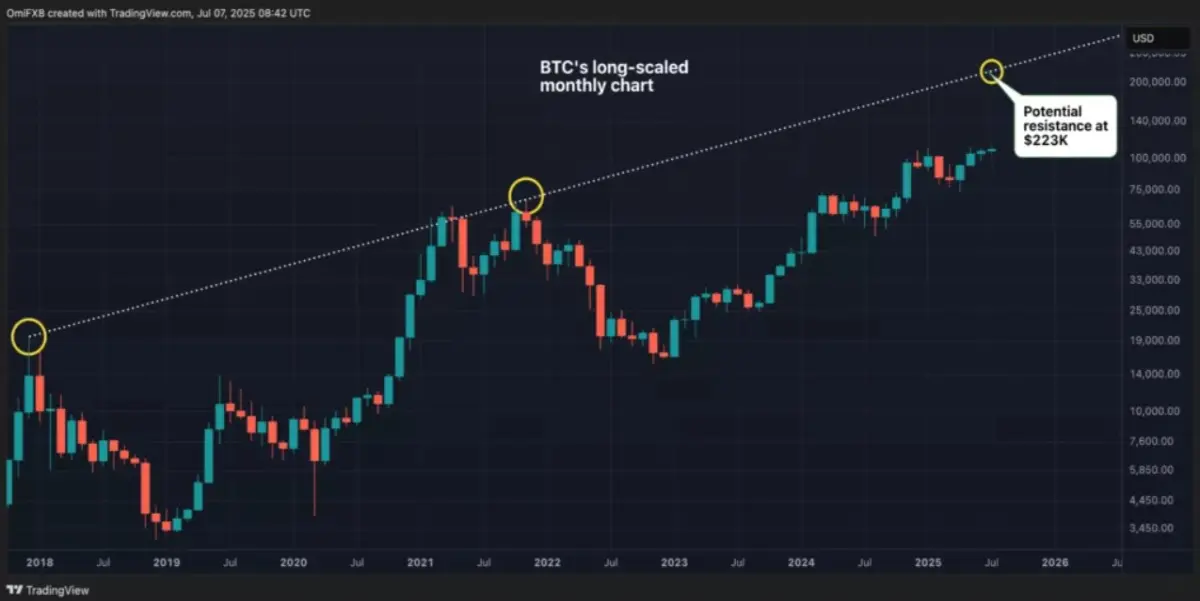
Monthly Bitcoin price chart on a logarithmic scale. Data: CoinDesk, TradingView.
With this approach, the line passing through the peaks of 2017 and 2021 indicates a resistance zone around $223,000 instead of $115,000. According to the analyst, this level better reflects the exponential nature of Bitcoin’s growth in past market cycles.
Recall that CryptoQuant analyst Axel Adler Jr. predicted a “moderate” Bitcoin growth up to $160,000.






