
...there is a strong divergence on the RSI at the Daily chart.
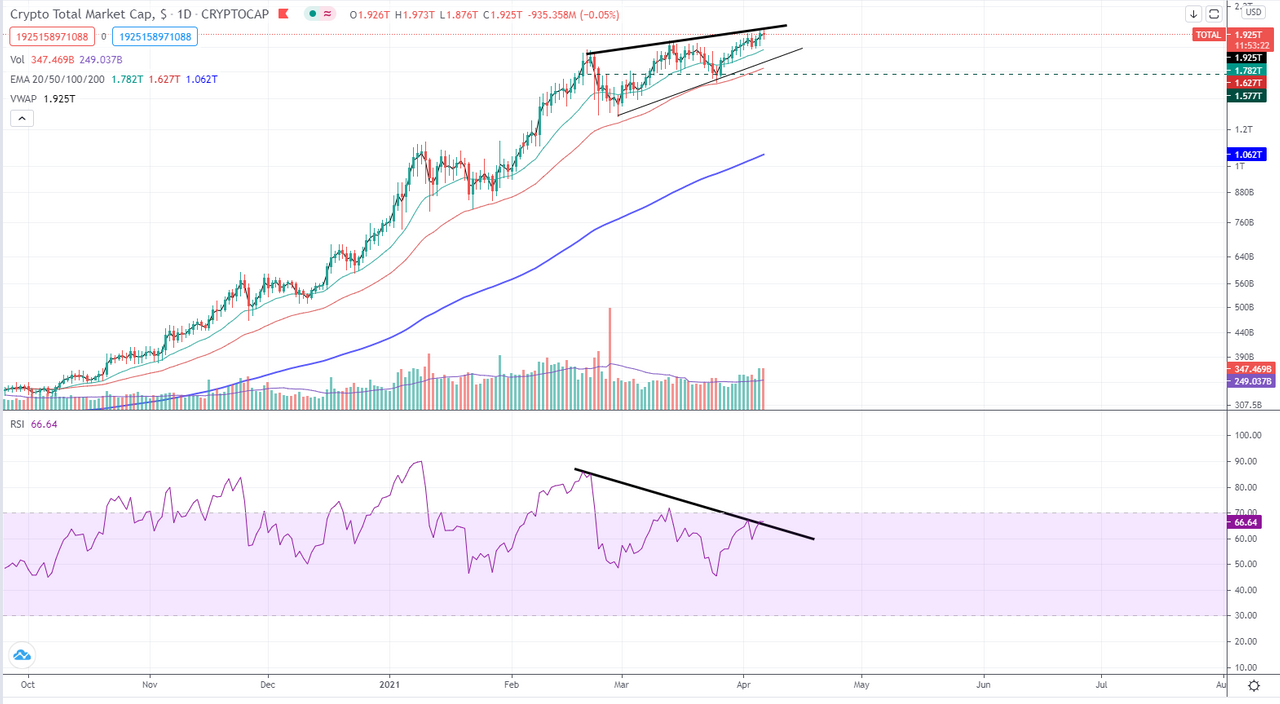
I have no idea how sustainable this situation can be, it clearly looks like a full-blown Bearish Divergence although if we look at the monthly chart, it does not seem that the RSI has reached its all-time high either:
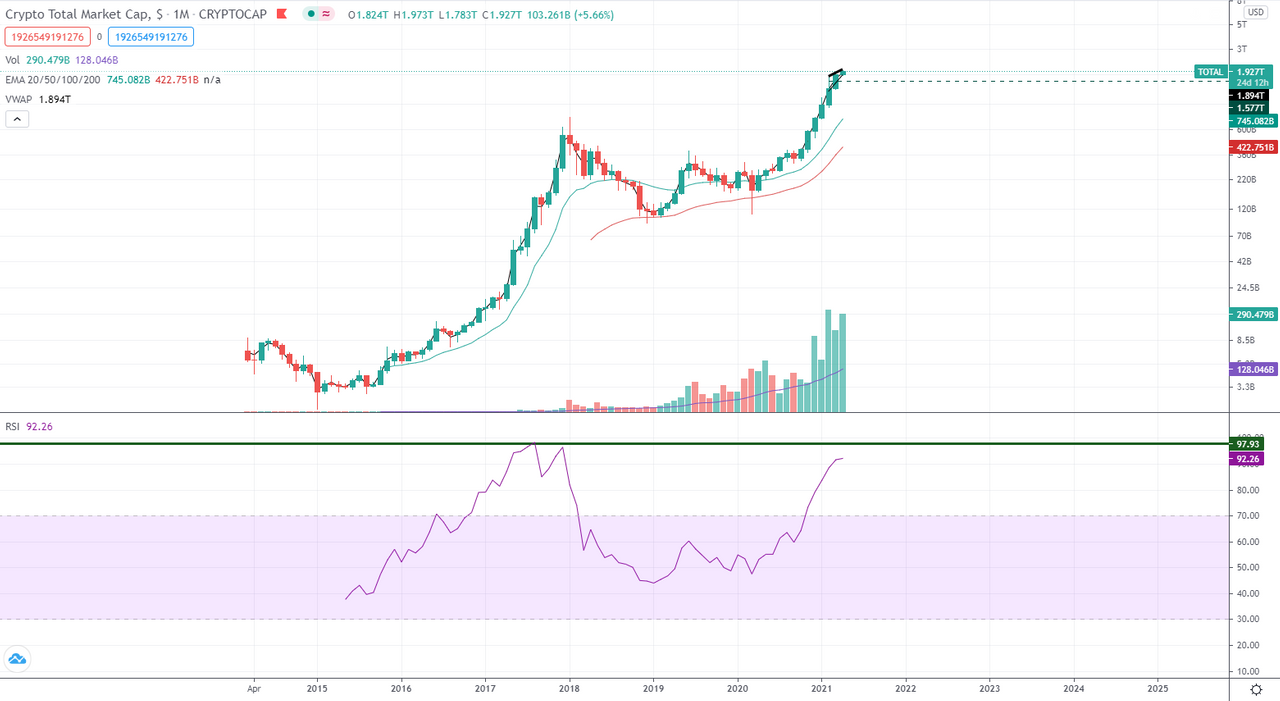
We are at a monthly RSI of 92, there are still 6 points to go to reach the previous top from which the price collapsed in the previous bull-run cycle.
But it is worth to mention, that the current level of Monthly RSI corresponds in time to May-2017 in th past Bull-run cycle and the Total Market needed then 7 months more in order to reach its summit.
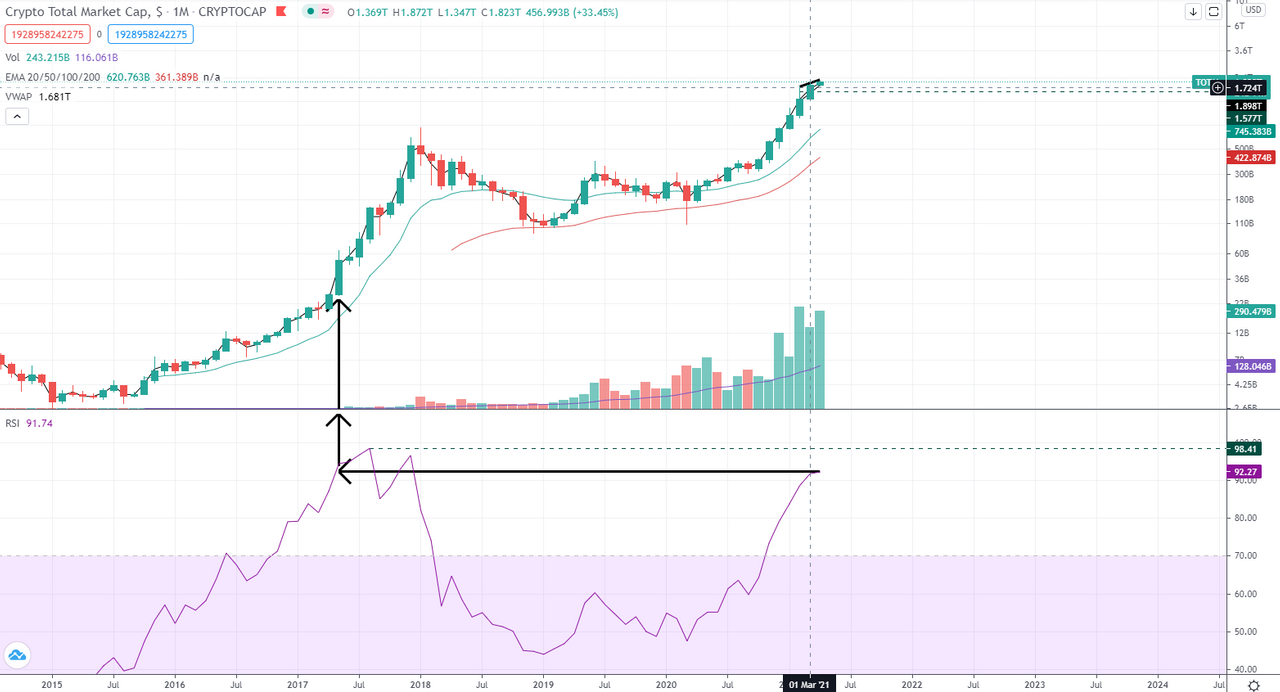
Will it be the same this time?
*Disclaimer: This is just my personal point of view, please, do your own assessment and act consequently. Neither this post nor myself is responsible of any of your profit/losses obtained as a result of this information.
Posted Using LeoFinance Beta


