
Ripple (XRP) is one of the fastest and most scalable digital assets with its own blockchain, enabling real-time global payments anywhere in the world.
Although Ripple's multiple partnerships with banks, and cross-border pilot programs XRP, as you see the weekly XRP BTC chart below, was decreasing for eight months. It has recently break out the descending triangle chart pattern and retested current support level of 0.00002490 BTC,forming a double bottom chart pattern, XRPBTC pair is now trading at 0.0000 BTC (equivalent to $0,23) at Binance.com.
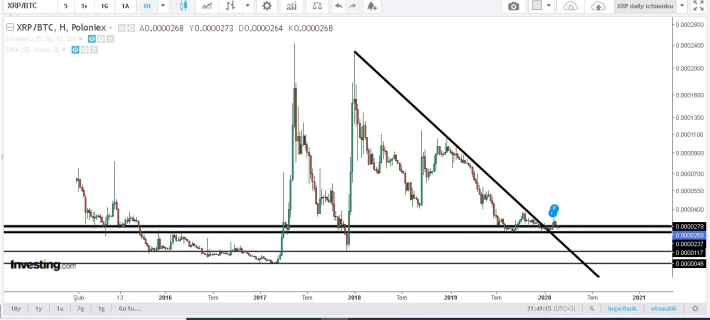
Outlook for XRP?
Today I am going to analyze XRPBTC pair using Ichimoku cloud.
As you know Ichimoku is swing trade range chart. It is a collection of technical indicators that show support and resistance levels, as well as momentum and trend direction. That's why it provides trading signals. It was developed by journalist Goichi Hosoda and published in his 1969 book. Source: school.stockcharts.com
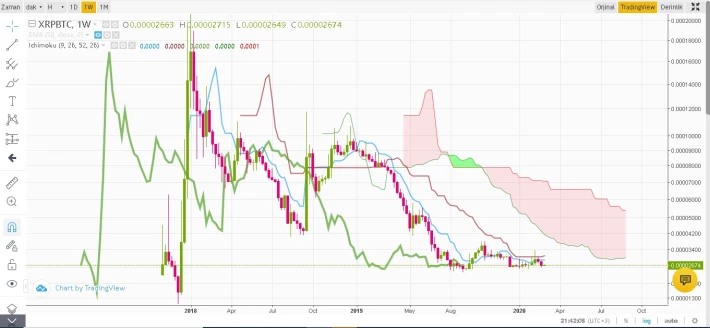
As you see the weekly chart price action is not only below the clouD but also below the conversion line (Tenkan-sen) and baseline (Kijun-sen). This is bearish.
Moreover, Tenkan-sen (fast MA line) is below the Kijun-sen (slow MA line) and the crossover has not occurred yet. Their slopes are close to zero.
Chikou span (lagging span- bold green line above) is below the price action, and the conversion line (Tenkan-sen) and baseline (Kijun-sen).
Daily Ichimoku Cloud is still red.
So weekly Ichimoku cloud analysis indicates that XRP is still bearish. But as we look at the chart carefully XRP has been testing the critical support levles. and the conversion line (Tenkan-sen) and baseline (Kijun-sen) are close to horizontal. So we need to pay close attention to conversion line because it may cross the baseline very soon. Remember XRP formed a double bottom chart pattern, and break the 8 months downtrend.
Checklist for a bullish case:
In order for XRP to be bullish and for a safe entry level, here is the check list:
* Pprice actions should be above the cloud,
* Price actions should be above conversion line (Tenkan-sen) and baseline (Kijun-sen),
*Tenkan-sen (fast MA) and Kijun-sen (slow MA) lines crossover should occur and their slopes should be positive.
* Chikou span (lagging span) should be above the cloud.
* Future cloud should be green as well. In this case it means the future is green based on the 26-period projection.
Thanks for reading. I hope you’ve found it helpful.
*********************************
-- Earn free Bitcoin, go to cointiply.com, the highest paying Bitcoin faucet.
-- Sing up Foldapp and and get 20,000 free satoshi use.foldapp.com/r/Es9Jlefo
-- Get Free Verge (XVG), ByteCoin (BCN), Steem, Tron (TRX), Siacoin, Bean cash, etc. at theCryptoFaucet thecryptofaucet.com
-- Do not forget to use Brave Browser instead of Chrome ( download here BRAVE browser and get BAT token ($5)

Download mobile App and earn LTC here at bitcoinaliens Litecoin
-- Claim your free LiteCoins here at free-litecoin.com
Download this mobile App and earn BCH here at bitcoinaliens BitcoinCash
-- Claim your Free Bitcoincash here at free-bcash.com






