
Nifty 50
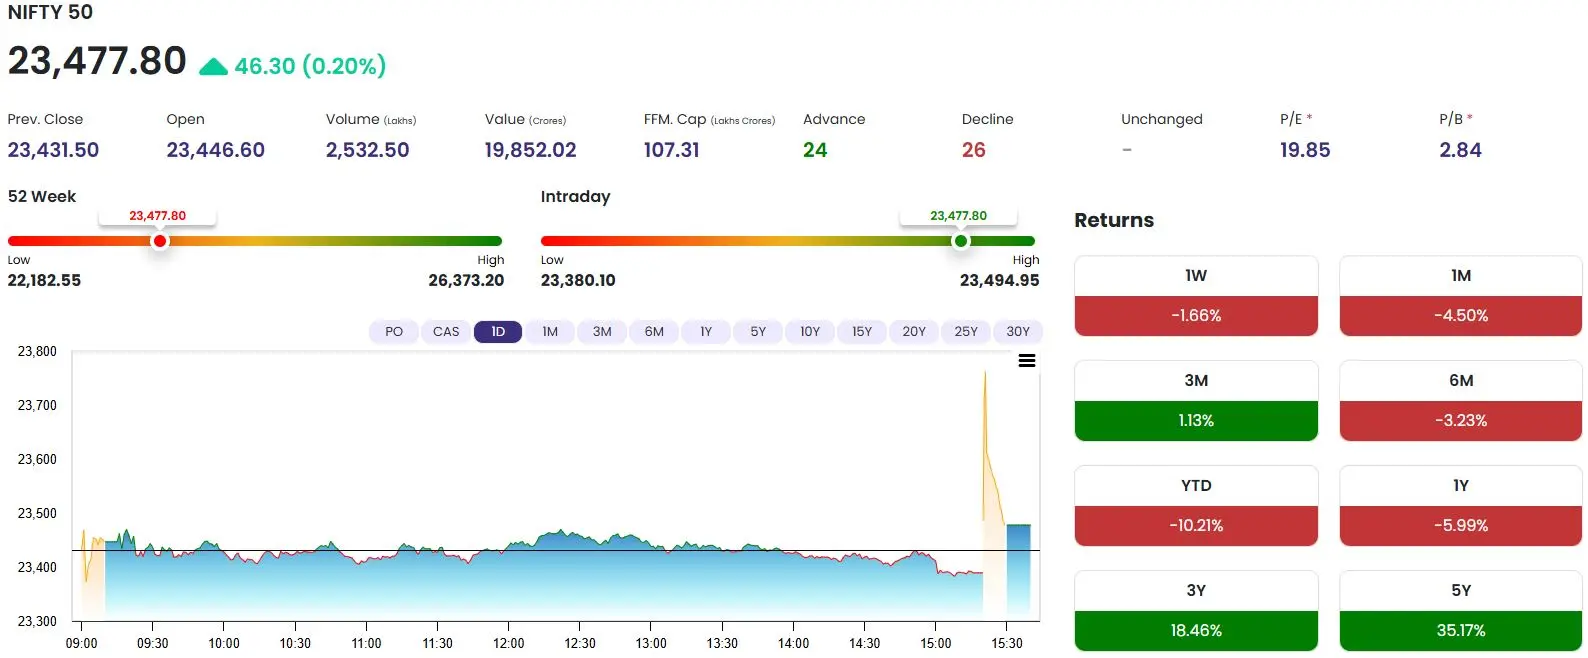
Let's talk about yesterday's Nifty 50 session showed a modest recovery with the index closing at 23477.80, up 46.30 points (+0.20%) after several sessions of persistent selling pressure. Nifty opened at 23446.60 and initially struggled for direction, but importantly managed to defend the lower region despite touching an intraday low of 23380.10. The index spent most of the session consolidating around 23400-23460, suggesting that aggressive selling has temporarily cooled , although a strong bullish reversal has not yet developed. Nifty eventually finished close to it's intraday high of 23494.95, which is a constructive sign because buyers regained control toward the close.
Market Breadth, however remains mixed at 24 advances versus 26 declines, meaning today's positive index close was not supported by convincingly broad participation. The 23350-23400 region is now an important short term support zone; a decisive breakdown below 23350 could restart the bearish move toward 23250 nad 23150-23200. On the upside, 23500 is the immediate hurdle, followed by a more important resistance area around 23550-23600; Nifty needs to reclaim this region before the recovery can be treated as more than a relief bounce.
Despite today's green close, the larger short-term structure remains bearish-to-neutral, particularly with the 1-month return at -4.5%, YTD at -10.21% and 1-year return at -5.99%. For the next session, CE becomes more attractive only if Nifty sustains above 23500-23550, whereas rejection from that zone followed by a break below 23380-23350 would again favor PE setups.
Overall View: Neutral with a mild recovery bias, but not yet bullish - today's session looks more like stablization after a sharp decline than confirmation of a trend reversal; bulls need 23550-23600, while bears need 23350 to trigger the next directional move.
For the next session, i would wait for confirmation rather than pre-selecting CE or PE the index is currently sitting between support and resistance, where option buyers can easily lose premium to sideways movement.
This analysis is not guaranteed outcome or any personalized financial advice be cautious before taking any trade. Do your market analysis and study before hand. This analysis is based on the closing market for Nifty 50 today and for educational purpose.
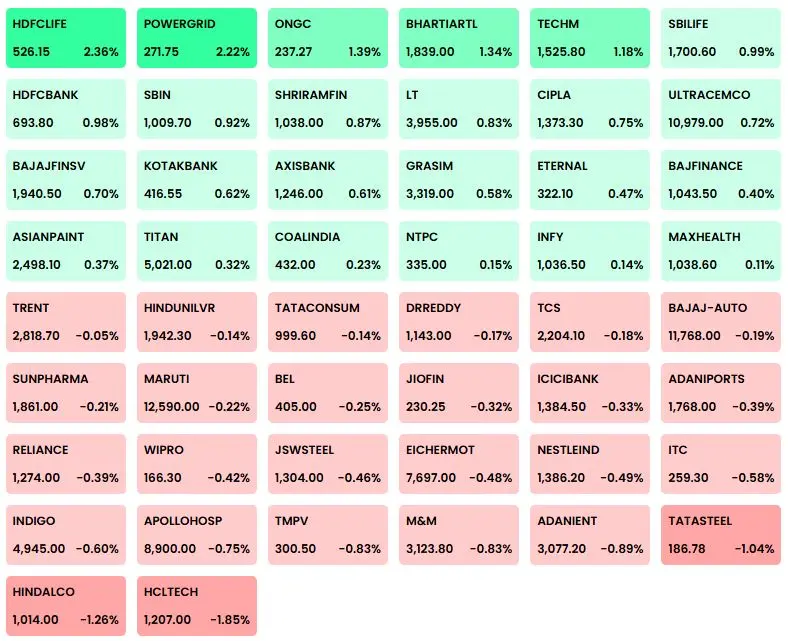
Heatmap
Thank you for reading my content as always really appreciate your efforts.





