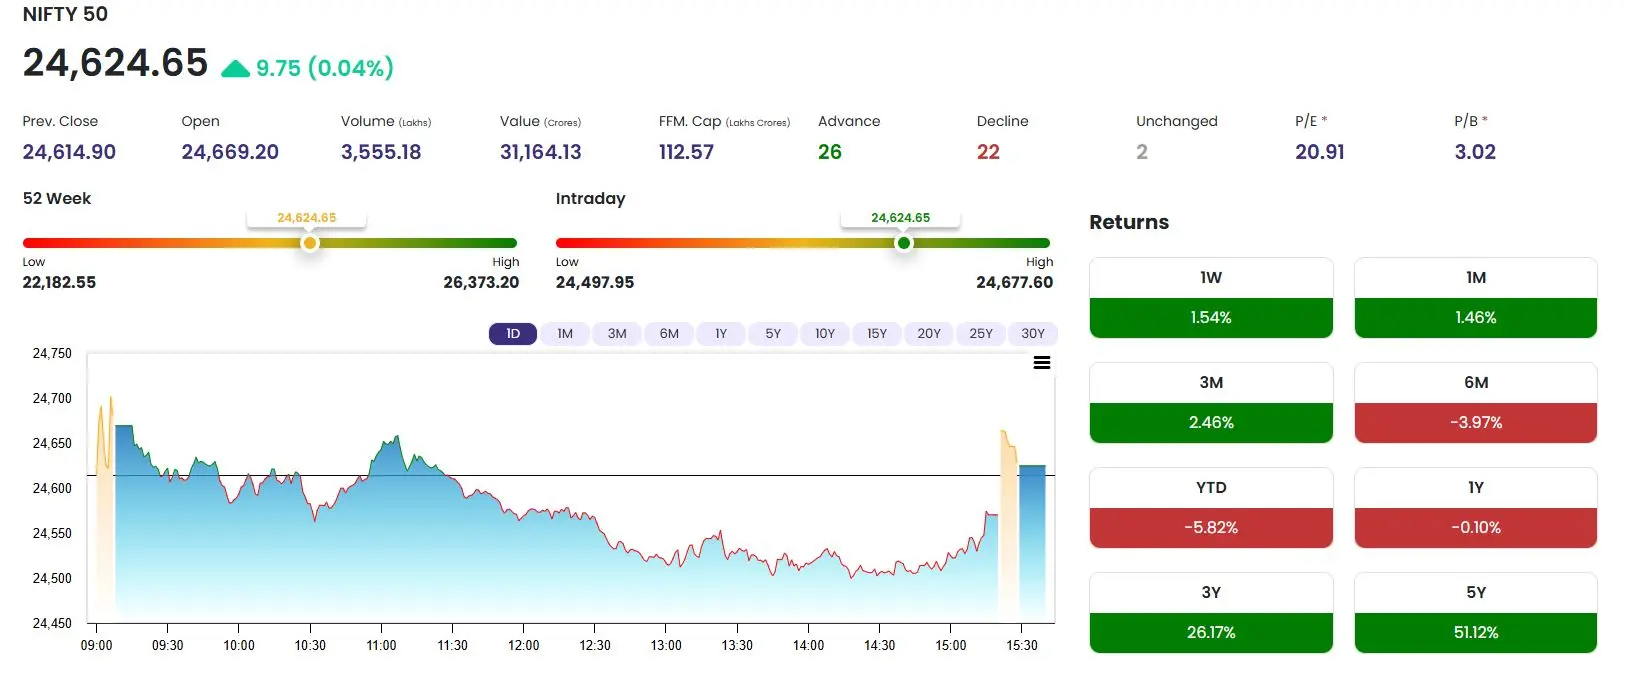
Nifty 50 Chart 1Day analysis

Nifty 50 5th August


c9ed32fa6ec567fdb7dcbdbff438f3699a453e929a3cadbe3f57a2a4459bca4d.jpg

Looking at the above Nifty 50 chart it can be seen after market closing the price is up due to Closing Auction Session(CAS). 

Intraday Chart Analysis

The index opened strongly at 24669.20 but faced immediate selling pressure, hitting a bottom near 24500 around 14:00. A sharp recovery ensued in the final hour of trading, allowing the index to erase it's losses and close slighlty in the green. 

How do you rate this article?

1


LifeImpression
LifeImpression

i am a fellow blogger interested in reading and writing content. Thank you


Indian Market Equity/Index

Hi guys just analysis for Equity /nifty 50/Gift Nifty 50 & other stocks. i am not advicing anyone to copy this strategy or analysis. It is just for Education purpose.

Publish0x

Send a $0.01 microtip in crypto to the author, and earn yourself as you read!

20% to author / 80% to me.
We pay the tips from our rewards pool.

Page not displaying correctly?

