
Volumes are a very important metric to evaluate when trading. In particular, the volumes can indicate the direction of the market and a possible trend whether increasing or not. Increasing volumes can indicate both rises and falls (buy or sell-off), depending on the direction of the market. Absence or decrease in volumes, on the other hand, indicates laterality or in any case high volatility without defined trends (fast dumps and pumps).
I can consider two types of volumes:
-amount of operations performed in a session
-number of trades entered into the market on a price threshold (volume indicator/profile on TradingView). In this case we will have histograms, the length of which indicates the economic volume of these transactions, while the line starting from the widest bar indicates the absolute point of greatest concentration of transactions in the chosen interval. These volumes are comparable to supports and resistances (in the event of a "bullish trend", I will check the volumes obtained in the previous descending trend and I will have an idea of where the price will find major obstacles and where it will be possible to go up without major problems or where I find the histogram bars shorter). In general they tell us how many orders are entering the market (long and short), limit orders do not affect the price movement until they are executed. The red or green candle that pushes the price down or up is simply given by the "delta" (difference between buy and sell orders). A market can move up: new longs enter or shorts close (the market reacts in the opposite way, leading to the upside)
For example, fast pumps with low volumes may indicate false movements, followed by a dump. These sudden movements are called "Barts", precisely because they recall the head of the well-known Simpsons character.
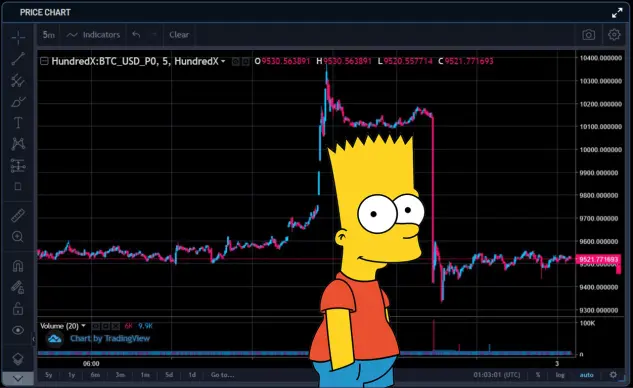
This type of movement can also occur in the opposite situation and we speak of bullish consolidation. In general, these low volume movements are caused by whales and market manipulation but are short-term movements. For these reasons they have little influence on the trend of the moment because they move in the opposite direction, before backing off. Lower or decreasing volumes correspond to the Barts and false movements (false breakouts and breakdowns), while increasing volumes indicate the predominance of a trend:
1) Increasing volumes as the price increases indicate an uptrend
2) Rising volumes with decreasing price indicate a bearish trend with investors who are selling
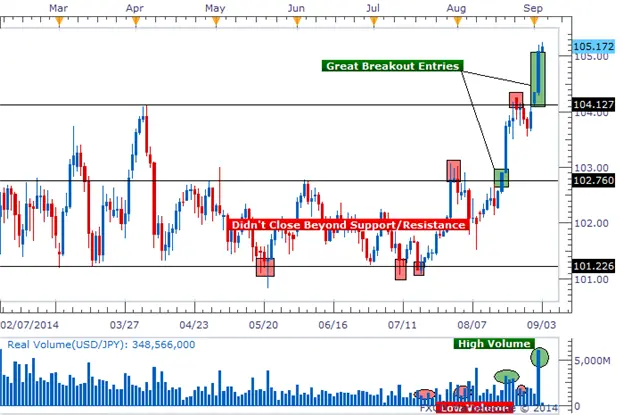
An increasing volume indicates that buyers and sellers are pushing the price up or down respectively. Volumes can decrease for long periods of time and this weakens the current trend but a real reversal is realized only when the volumes start to grow again. The volume should ideally be higher when the price moves in the direction of the trend and lower when it moves against the trend (pullback). In this case, the trend is more likely to continue in the prevailing direction. A high volume accompanied by sudden and different price movements against the trend indicates that the trend is weakening and the reversal is near. If an extreme volume spike occurs (over 5 times the average volume), this could indicate the end of a trend.
Are you interested in ways to earn crypto bonus? Check it out here: Some Sites To Earn Crypto Bonus (Old & New)






