
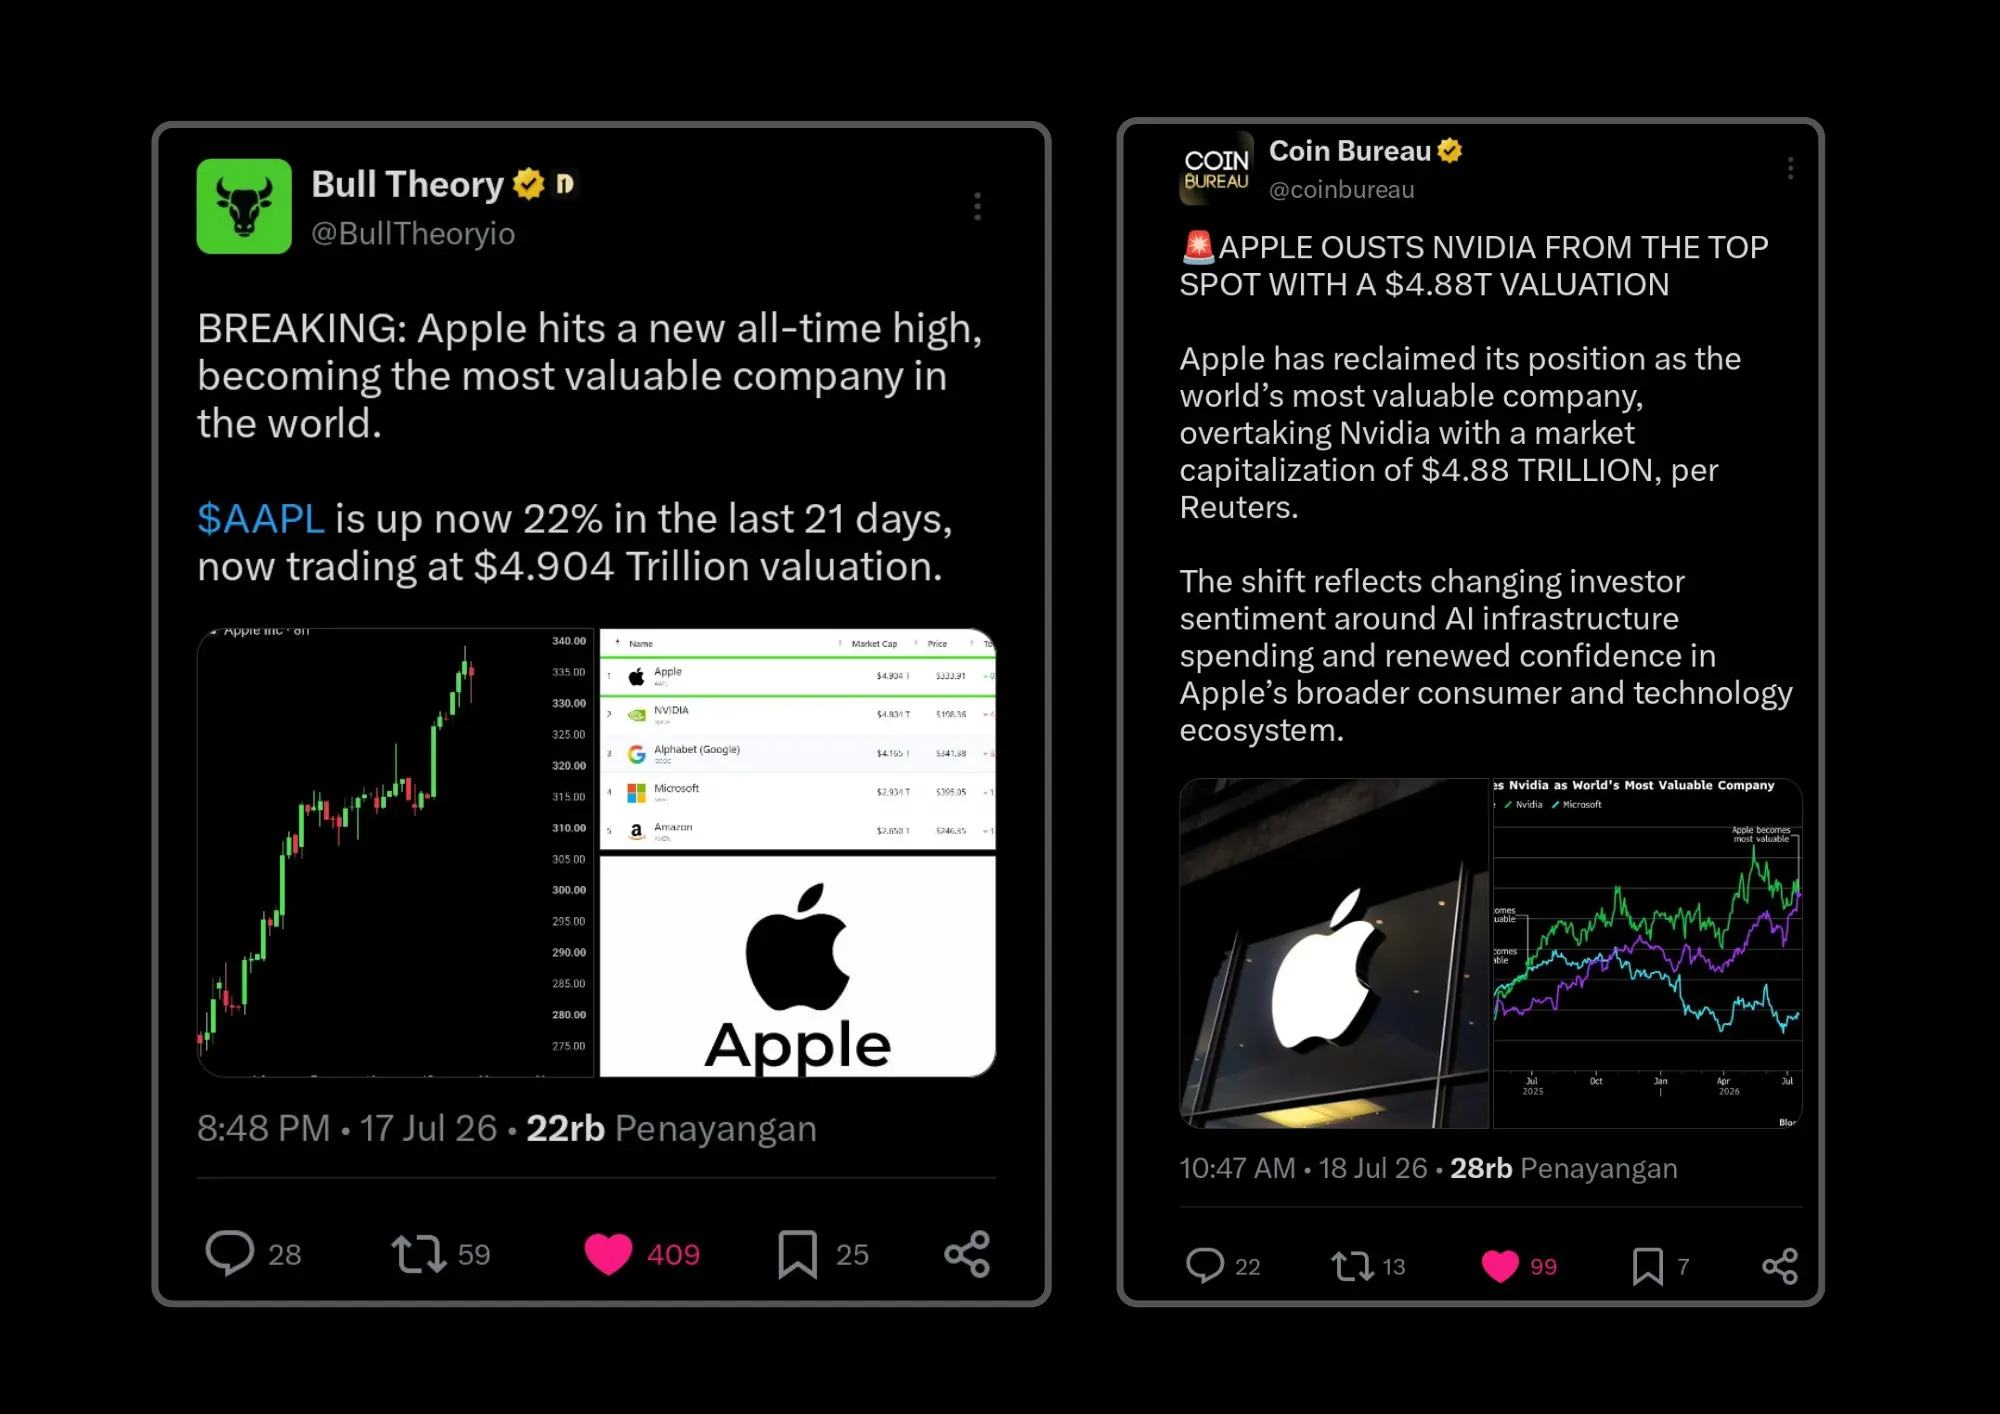
The global stock market just witnessed an incredible shift in capital as apple Inc pulled off a massive bullish expansion. Over a recent 21 trading days window, the tech giant’s stock price with ticker AAPL surged by 22%. This aggressive buying pressure pushed apple's market valuation back into the record books, hitting an all time high between $4.88 trillion and $4.904 trillion. With this move, Apple officially dethroned nvidia from the top spot of the global market cap leaderboard. Many macro traders view this as a massive rotation where capital is flowing back into reliable consumer ecosystems rather than just raw hardware infrastructure.
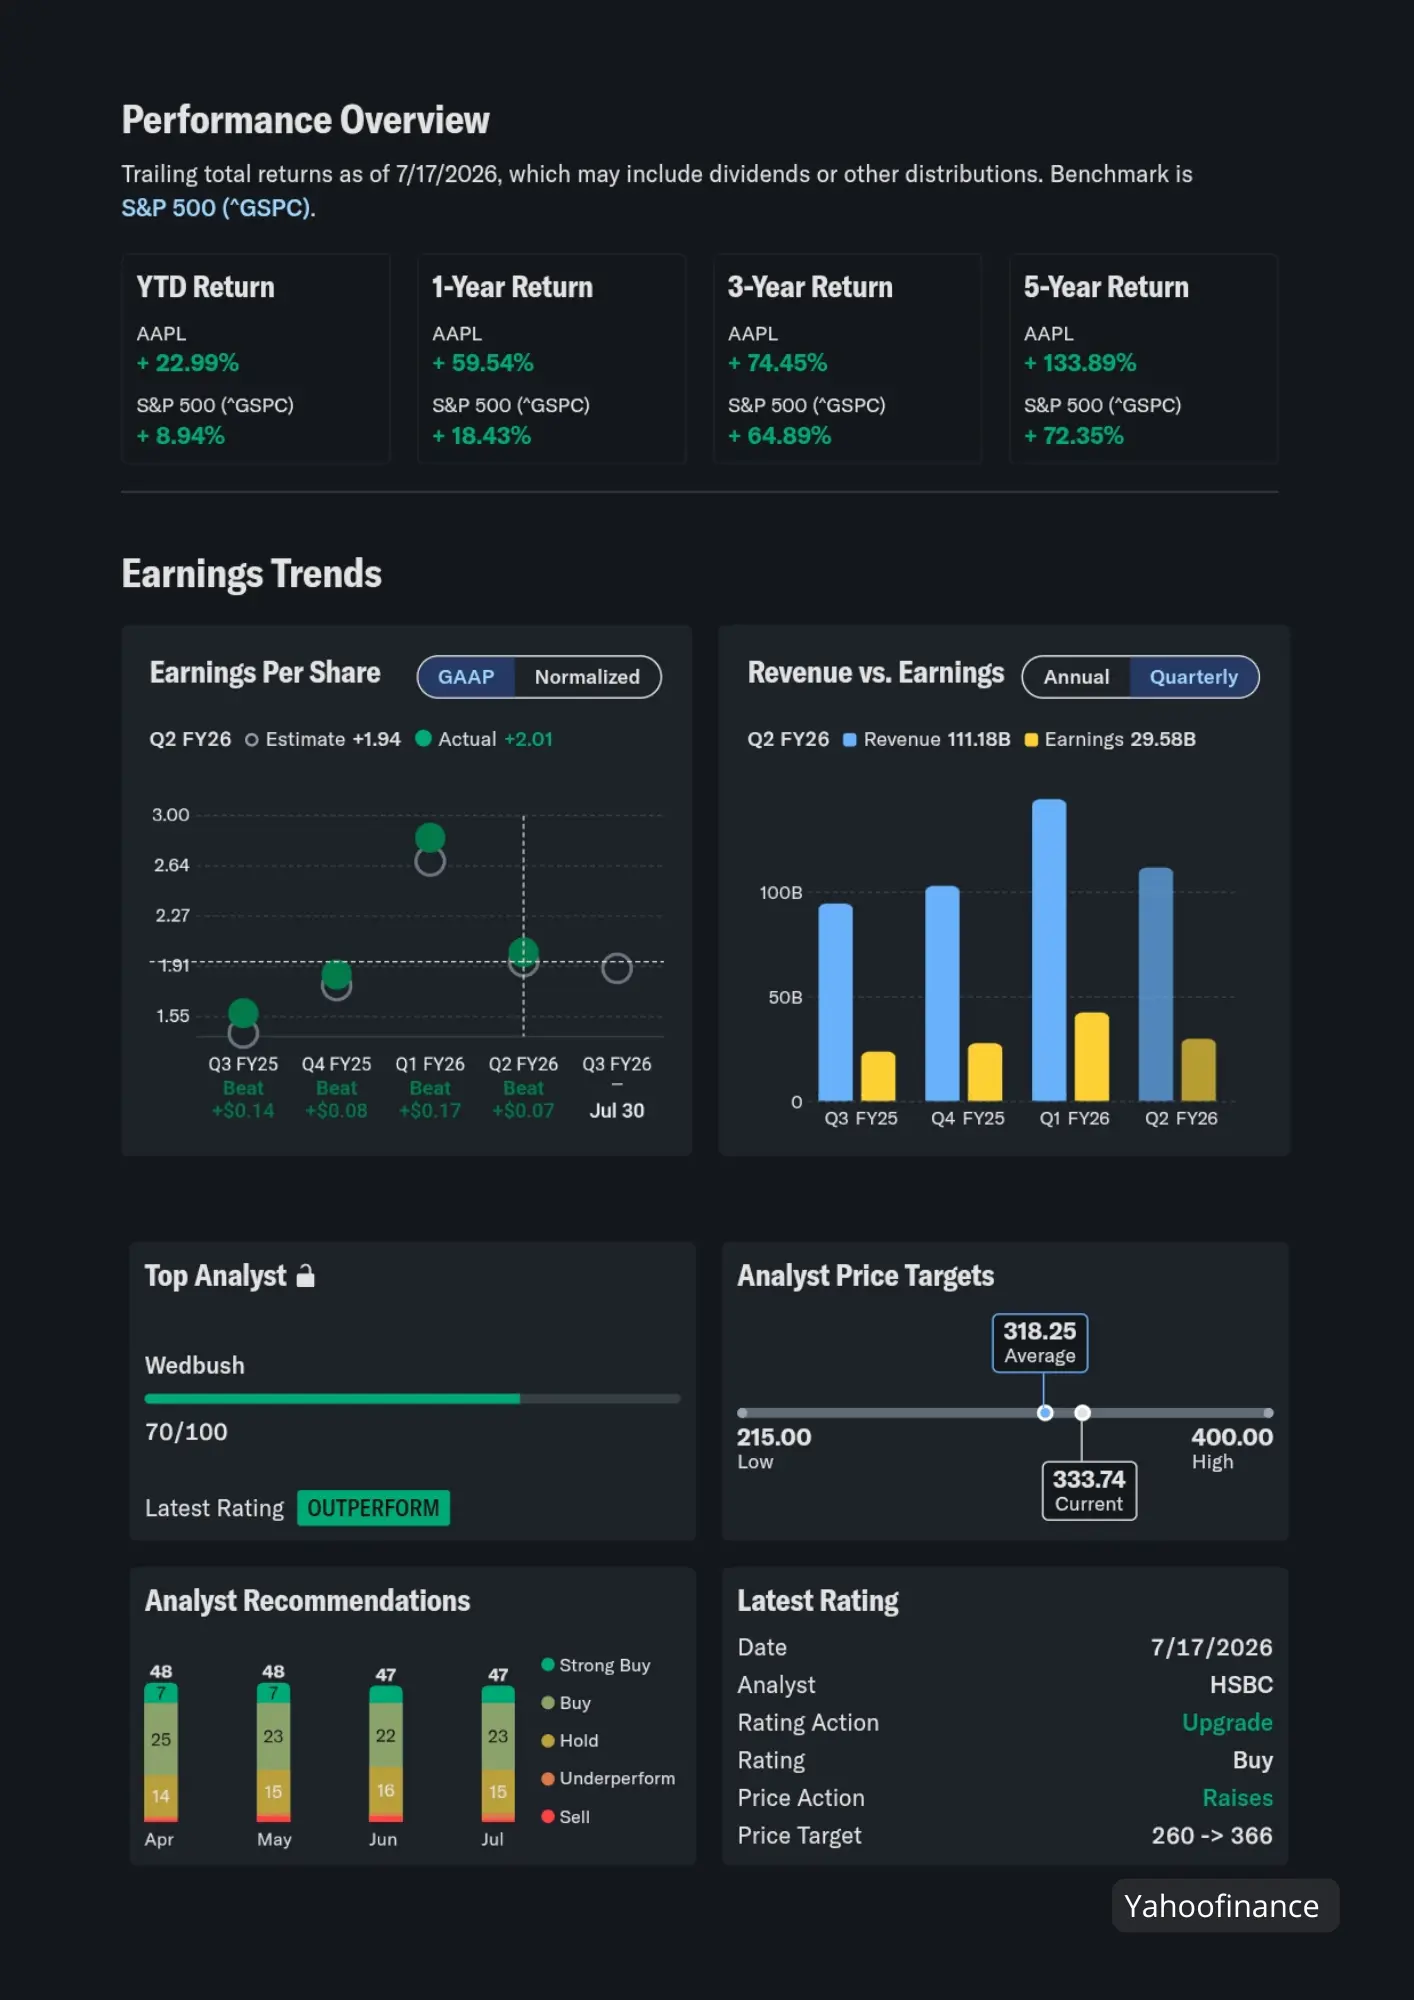
This massive move toward new record highs is not just pure hype because it is backed by an incredibly strong financial performance. Looking at the yearly metrics up to mid july 2026, AAPL has delivered a 22.99% return since the start of the year and an impressive 59.54% return over the past twelve months, completely outperforming the benchmark S&P 500 index. Furthermore, their second quarter fiscal 2026 earnings report showed an actual earnings per share or EPS of $2.01, which easily beat Wall Street's expectation of $1.94. During this same quarter, apple generated a stunning $111.18 billion in revenue with a net income of $29.58 billion.
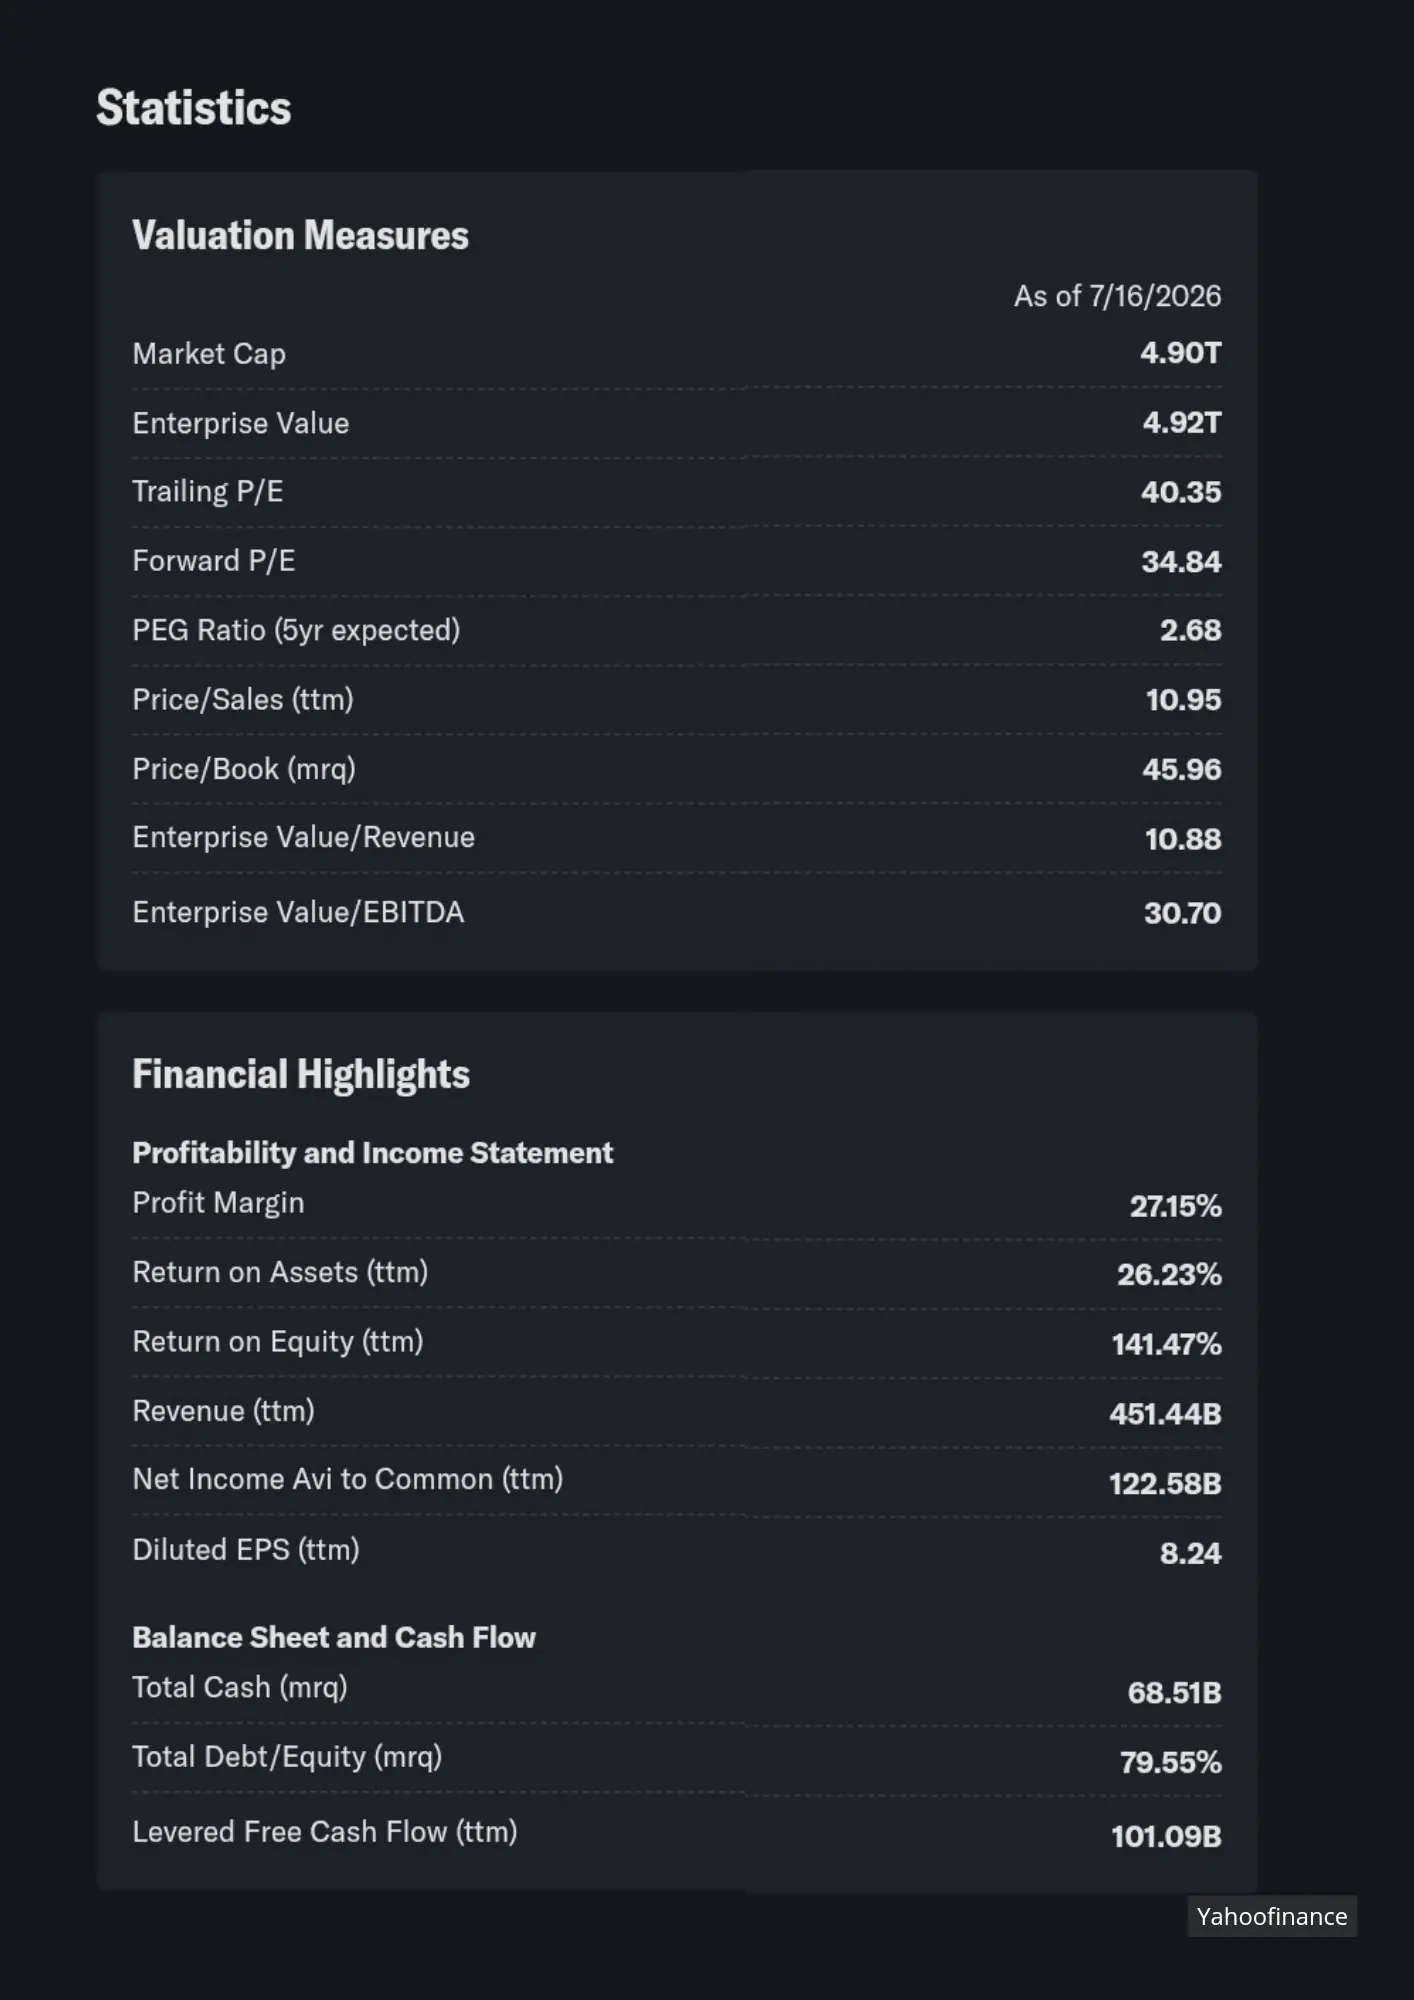
When we look under the hood at the fundamental statistics, apple’s enterprise value currently stands at $4.92 trillion against a market cap of $4.90 trillion. While some value investors might argue that a forward P/E ratio of 34.84 times is a bit premium, apple justifies this with its industry leading profitability metrics. The company maintains a healthy net profit margin of 27.15% and an absolute powerhouse of a return on equity or ROE at 141.47%. Their fortress balance sheet is also highly liquid, holding $68.51 billion in total cash and producing a massive free cash flow of $101.09 billion, giving them endless room for buybacks and further development.
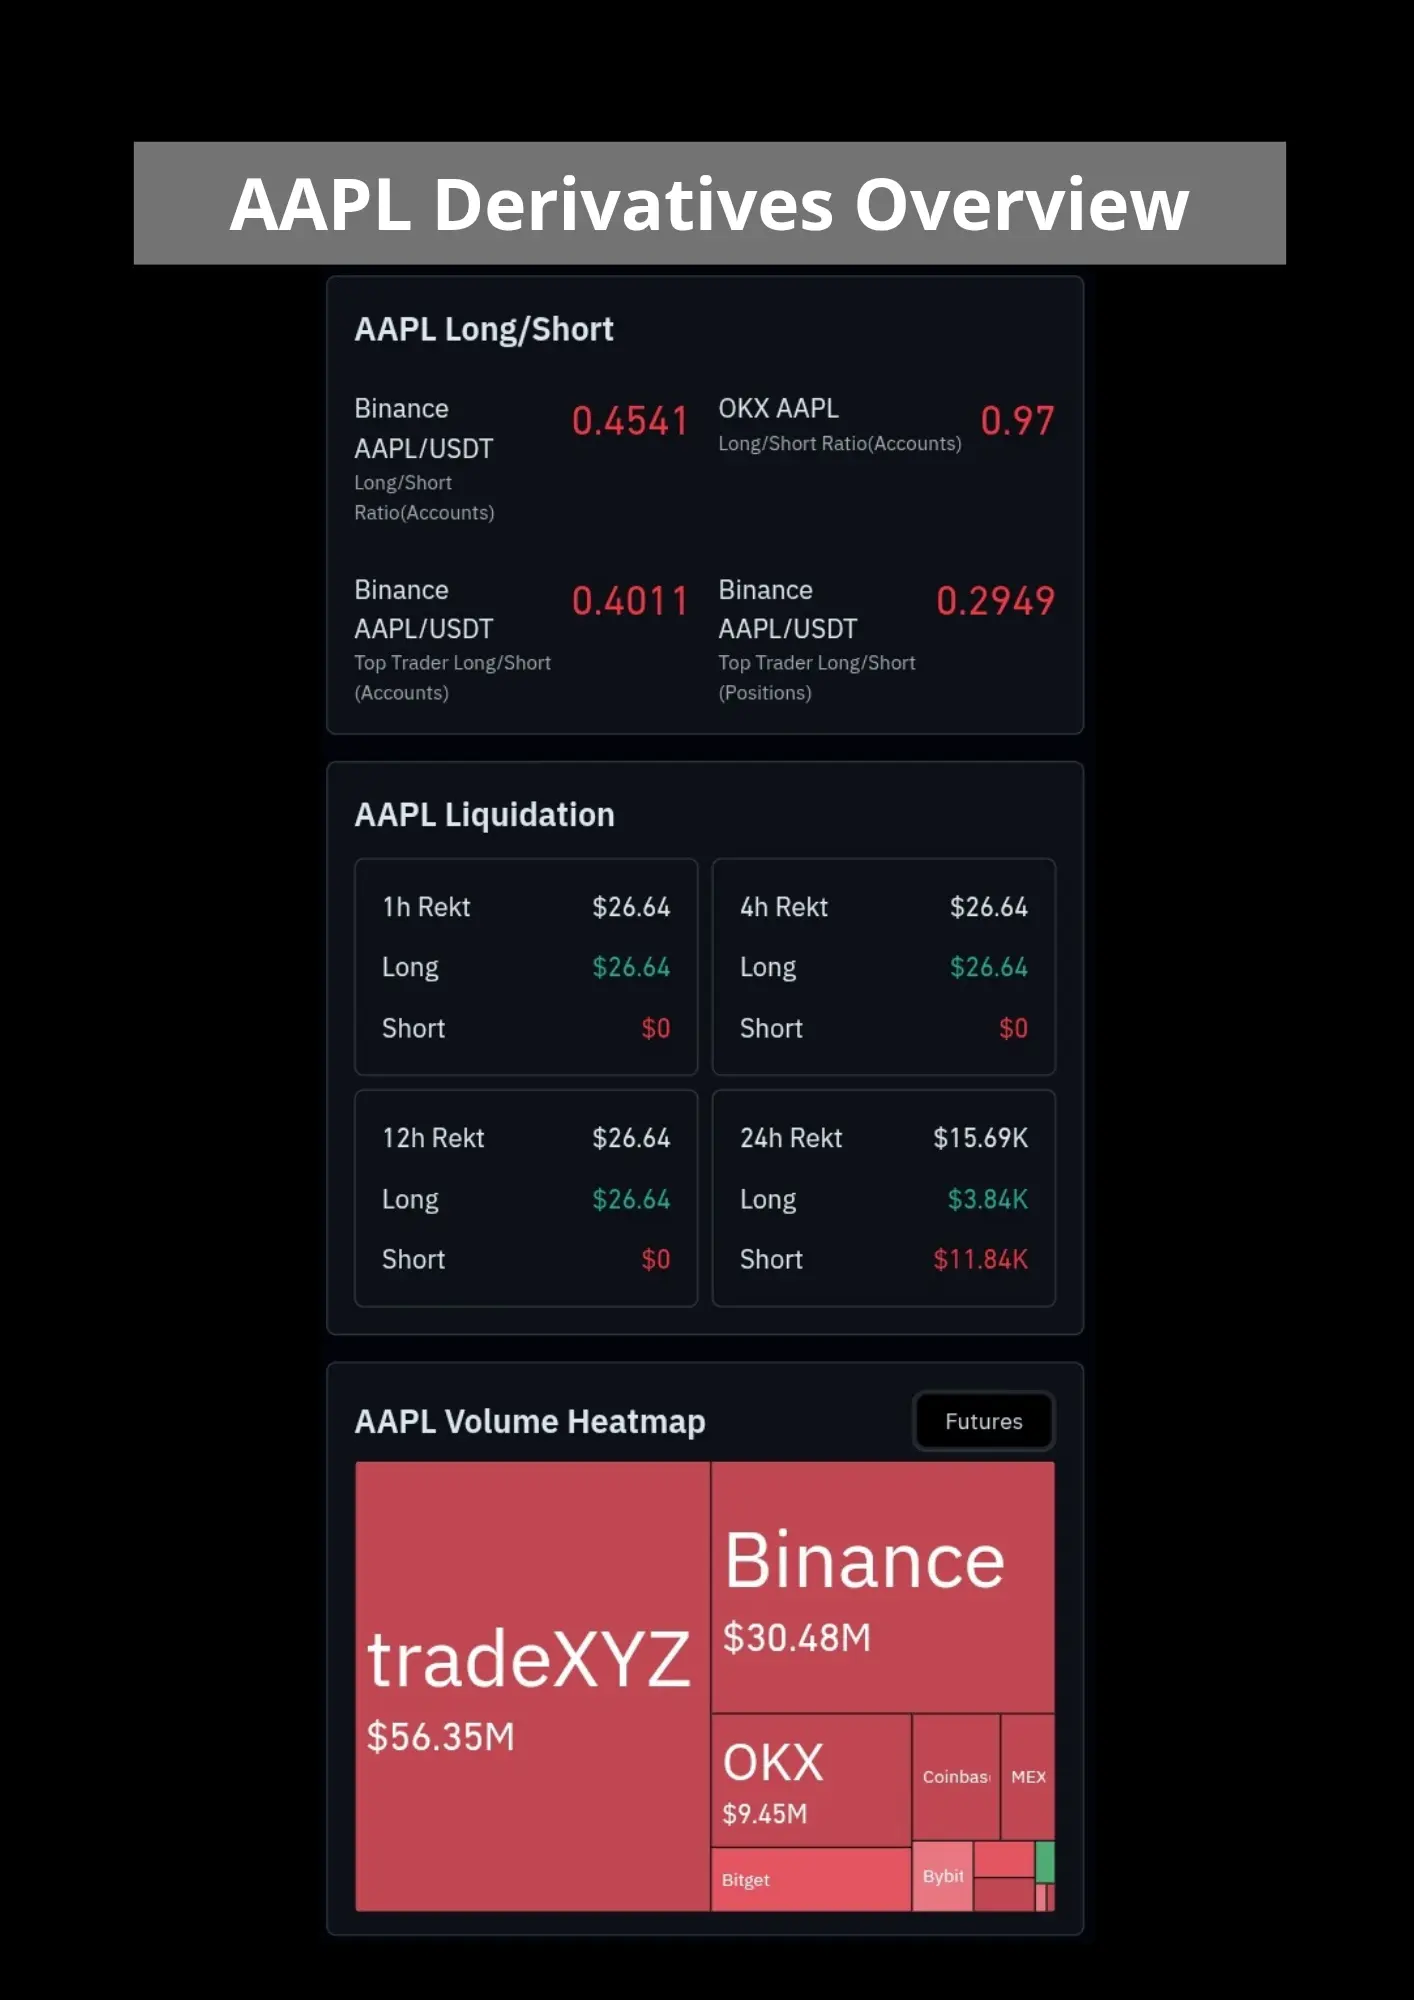
The intense volatility in the spot market has created highly lucrative opportunities over in the derivatives and futures markets. Interestingly, the retail long/short ratio across major exchanges has been hovering between 0.45 and 0.97, which reveals that many short term retail traders were actively trying to top fish and short this rally. This counter trend trading resulted in a massive trap where short positions got completely rekt, leading to over $11.84 thousand in forced liquidations within a single 24 hour window. In terms of trading volume, platforms like tradeXYZ and Binance have become the ultimate liquidity hubs, processing $56.35 million and $30.48 million respectively.
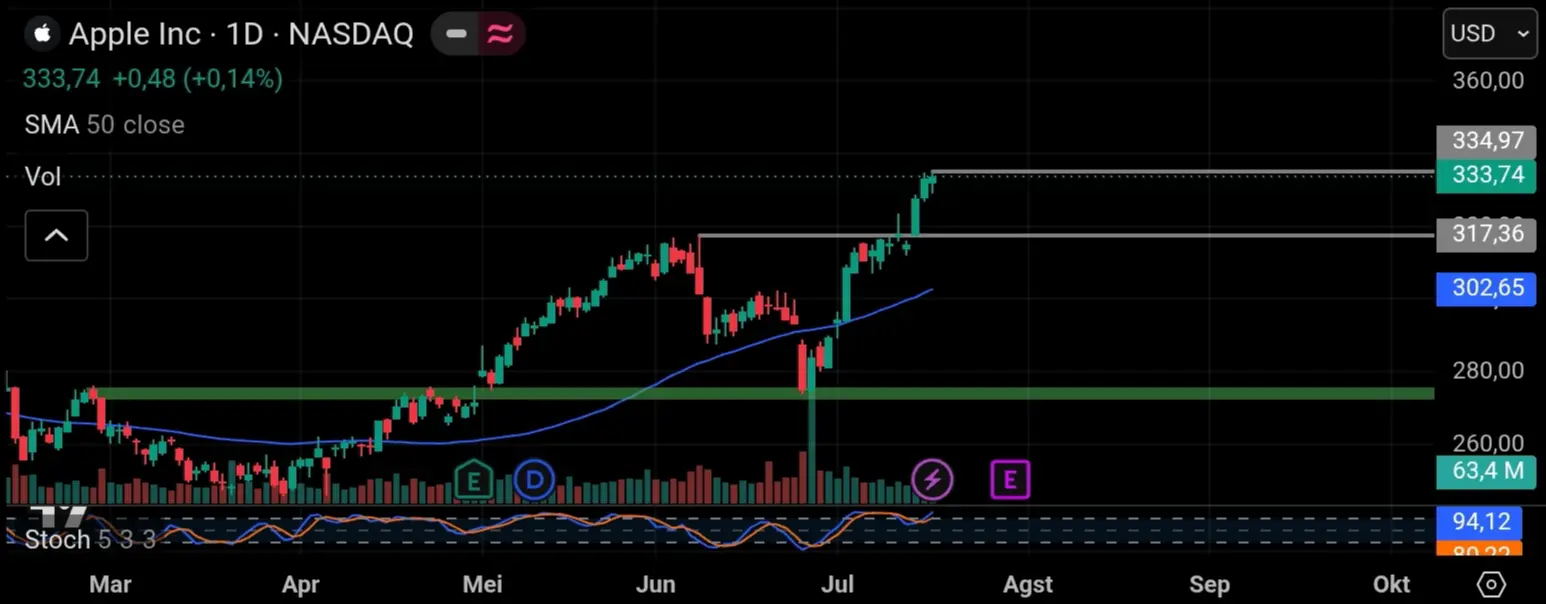
On the technical front, the daily NASDAQ chart shows that AAPL is trading incredibly strong around the $333.74 level. This move comes right after a clean breakout above the previous heavy resistance zone at $317.36, which has now flipped into a strong support level. The price action is currently trending far above the 50 day simple moving average or SMA 50, indicating that the medium term market structure is completely controlled by the bulls. Even though the stochastic oscillator is showing a heavily overbought reading at 94.12, the massive daily trading volume of 63.4 million shares proves that institutional accumulation is still pushing the price up.
My Opinion
From a trader perspective, trying to short a stock that possesses a 141% ROE and a clear technical breakout is a fast way to blow up an account. This upward expansion is a healthy combination of strong fundamental backing and momentum market structure. The smartest playbook for retail traders right now is to completely forget about shorting the top. Instead, wait patiently for the market to take a breath and look for high probability buy entries whenever a healthy pullback retests the previous breakout zones or key moving averages.
Click here to read my authentic and original analysis
Source
- Apple Intelligence Finally Cleared to Launch in China
- Apple surpasses Nvidia to become world's most valuable company
- Coin Bureau
- Bull Theory
⛔ Disclaimer: This article is strictly for informational and educational purposes only. It does not constitute financial advice, and no trading signals are provided.
Financial market trading including crypto, forex, and stocks involves high risks. While there is a potential to achieve substantial profits, there is an equal or even greater risk of experiencing severe losses, including the loss of your capital. Past market performance does not guarantee future results.
All investment decisions are your sole responsibility. Please ensure you conduct your own research (DYOR) before making any trades.
Keep trading and stay profitable📊






