
Introduction
The purpose of this article is to bring information about a controversial twitter post by John McAfee about altcoins and make a brief graphical analysis of these altcoins in the medium term. In case you don't know him, John McAfee is a famous programmer who founded McAfee, one of the first to create virus-scanning software on your computer. Since the goal here is not to talk about the feats or controversies surrounding this figure, so let's get to the point that we are interested in. Last month he tweeted that bitcoin will hit $ 1 million and that altcoins will be value 10x more, citing three only. See the publication below:
Docademic (MTC)

Throughout 2019 this altcoin had a variation in its price between $ 0.0044 and $ 0.01649. So far this difference already represents about 270%. Docademic (MTC) is currently trading at $ 0.012. This represents an accumulated appreciation in 2019 of around 215%.
Graphical Analysis (MTC/BTC)
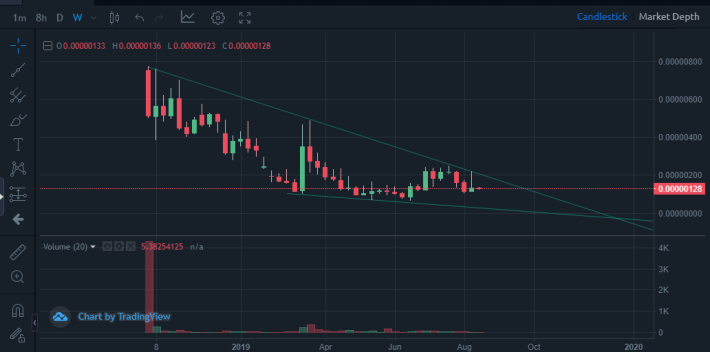
It is well known that at first the altcoins are overvalued because of speculation behind the currency and it is common to see a fall in asset prices, with the TCM no different, the graph shows us the formation of a triangle that may be In the end, the MACD indicator shows a loss of strength on the part of sellers (which are prevalent so far) which may be indicating that a surge wave may be starting. If this happens in the future the projection is that at the end of the five waves the price will reach its initial launch value. John states in his publication that asset prices may start to rise as soon as the BTC hits $ 12k, which by my projections the price will stabilize or overcome this resistance at the end of September.
It is important to remember that the chart shown is quoted in BTC as it could not find MTC/USD OR MTC/USDT.
Apollo Currency (APL)

At the time of writing this article Apollo is quoted at $ 0.00127 having peaked at the beginning of 2019 being 0.00373, it has devalued about 65% since then. Below is the real time quote of the currency:
Graphical Analysis
There is a great difficulty finding charts about this cryptocurrency as it is not listed on exchanges that provide graphical information nor is it listed on tradingview, so I took some information from the coin market cap and I will try to work with it.
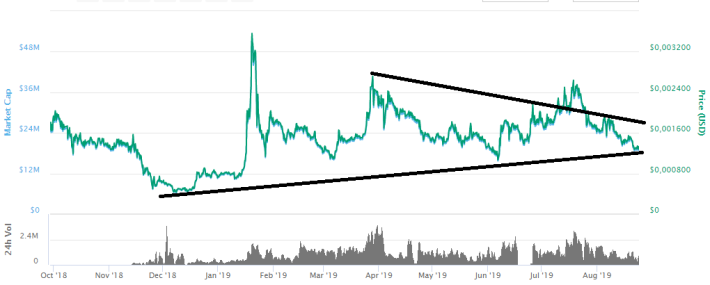
Apparently, we are in a growing channel since the rupture of the initial devaluation triangle. An attempt was made to overtake the current channel but was not strong enough to continue a bullish path, it is not possible to know the current market situation accurately as we do not have many indicators, but the drop in trading in recent periods may indicate a dispute between bulls and bears indicating an end to the downtrend, should this happen we can properly verify the traced support zone and possibly a further attempt to compress the channel.
Tezos (XTZ)
The current tezos price is $ 1.15. In 2019 it peaked at $ 1.83. It has appreciated by about 197% since the beginning of the year. Following is the real time quote below:
Graphical analysis
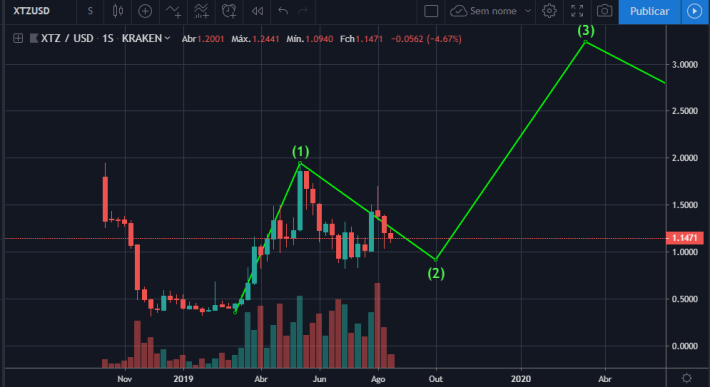
It is possible to identify a valuation wave in Tezos that coincides with an impulse wave 1 established in Elliot wave theories, we are now undergoing a correction that will lead us to a future valuation wave which may cause the value of Tezos to increase by considerable form. The weekly chart's relative strength indicator shows an uptrend, which may confirm that a new wave of appreciation is about to form.
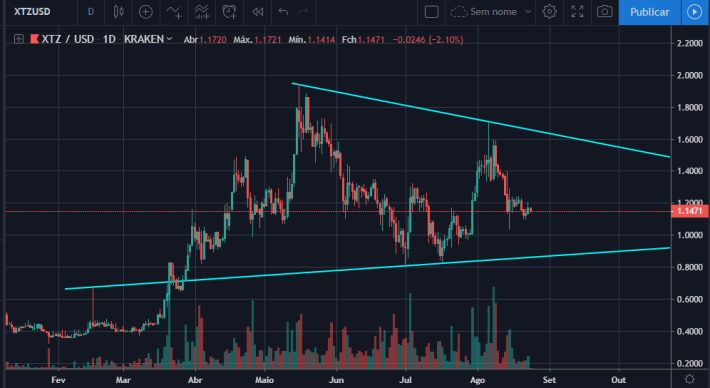
In the daily chart time it is possible to delimit the zone that is undergoing this correction and identify possible time pivots that give us an idea of when the correction will end to start a new wave of appreciation. Short-term indicators tell us that there is a neutral character to the market with possible fluctuations in the coming days. There isn't much to comment on cryptocurrency right now, just wait and see the reactions on the chart. Of all of them, this was the one that caught my attention and I will probably do more detailed analysis of it in the future.
Thank you for reading :D


