
Hey everyone👋. It is June 2026 and honestly, I have been glued to my screen watching the USD/JPY pair. It is getting pretty intense out there. Everyone is talking about that 160 level. While I am not a financial advisor, I wanted to share how I am looking at the charts and the chaos behind the scenes.
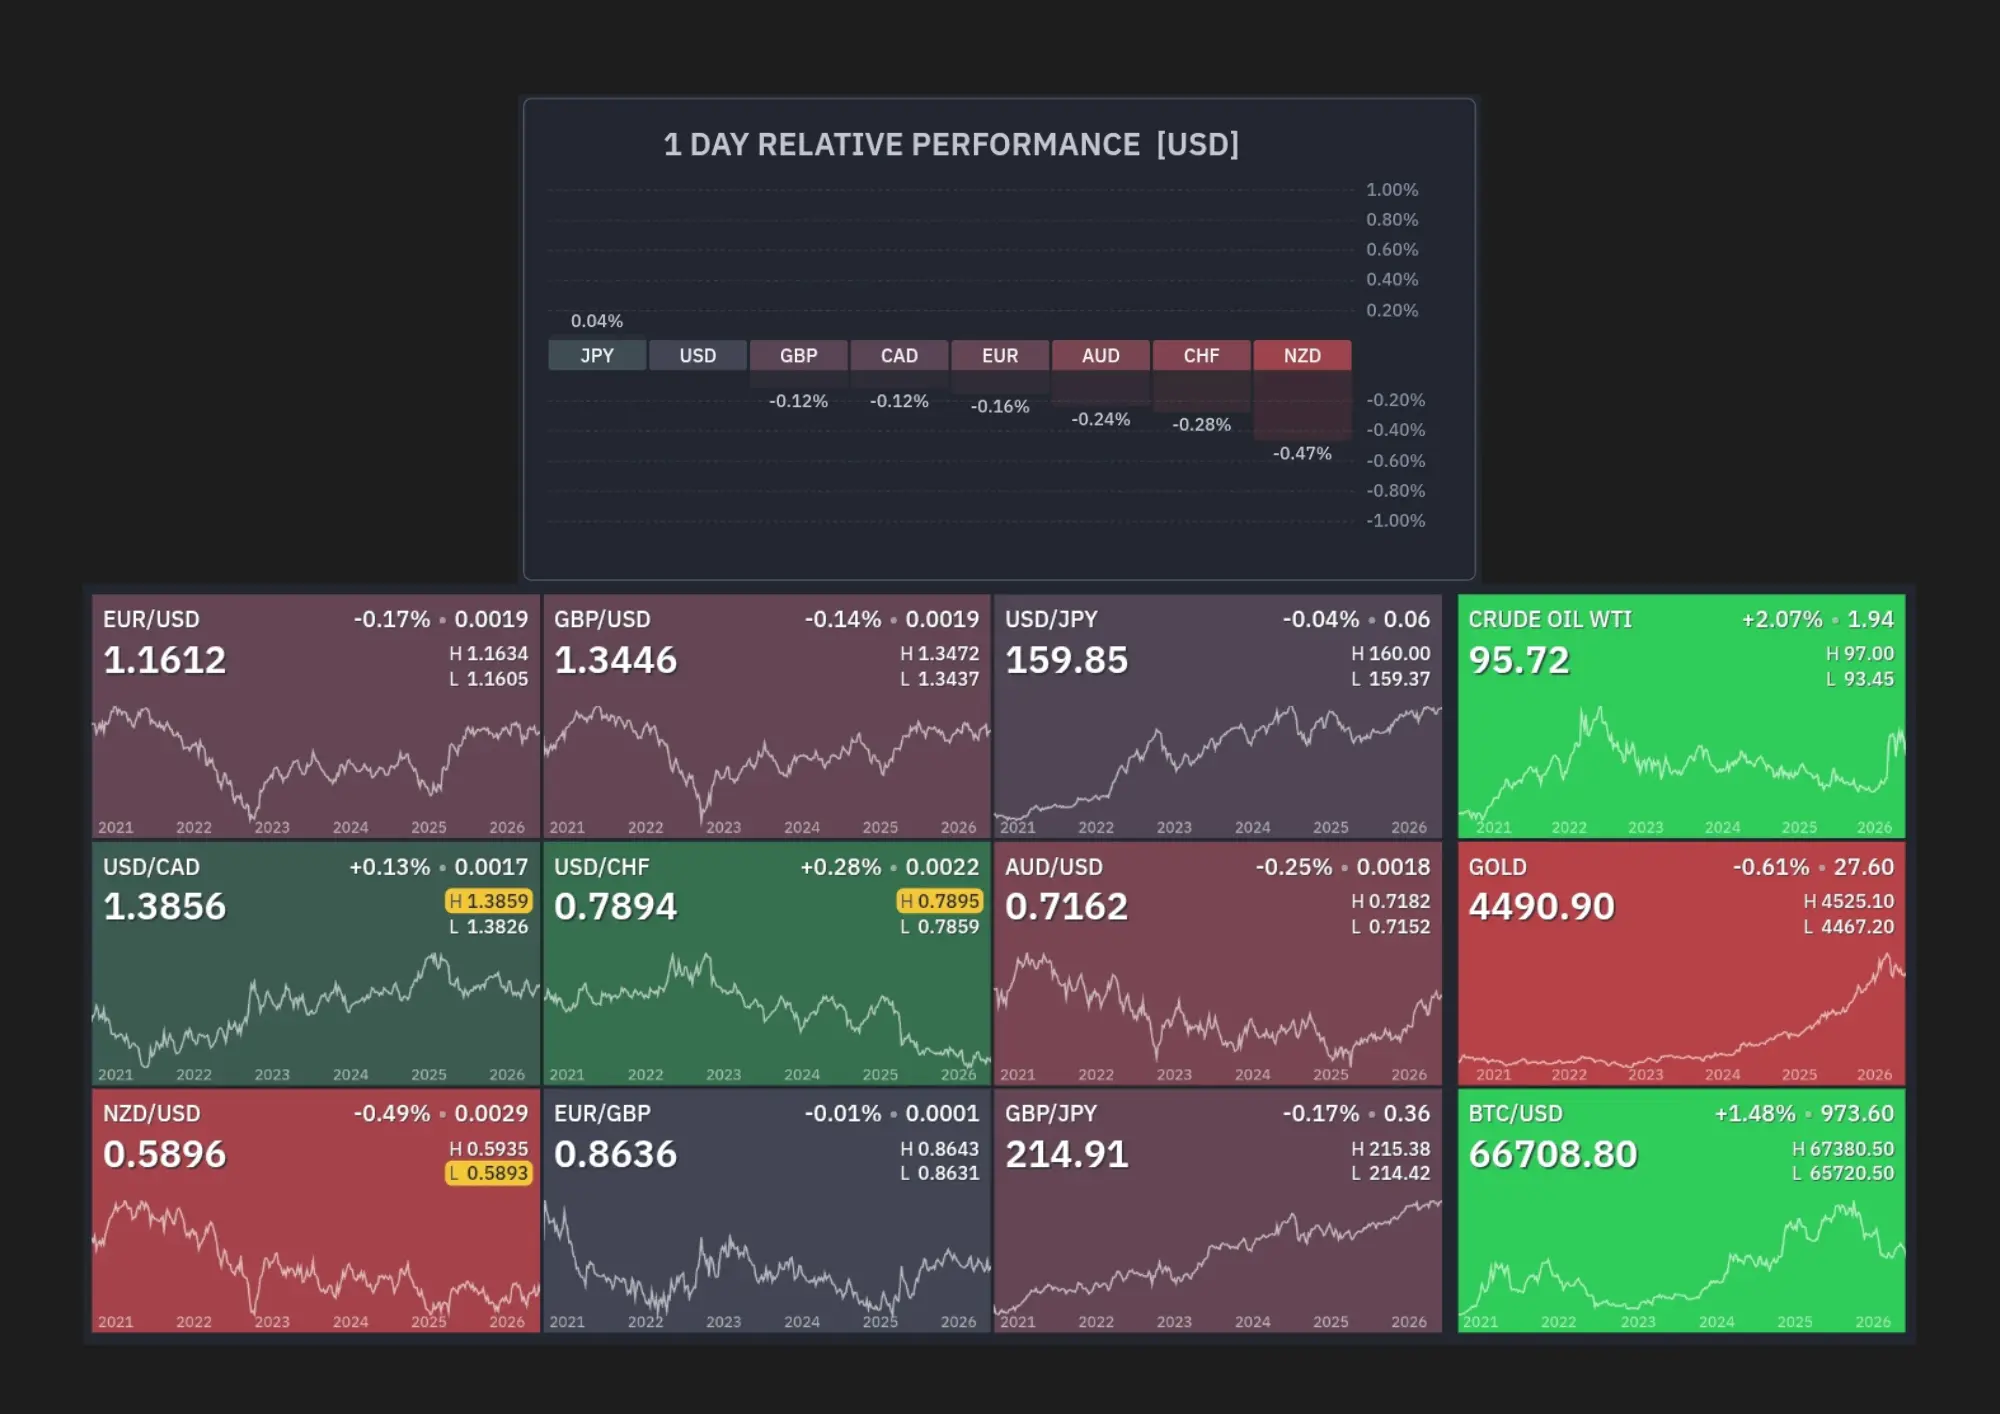
What is Actually Happening?
The Yen is getting hammered because the Bank of Japan is still playing it soft while the Fed is keeping rates high. It is a classic interest rate gap story. But the real talk in the trading community right now is all about intervention. Will they or won't they? That is the big question.
My Technical Notebook
I like to keep things simple by looking at the bigger picture first.
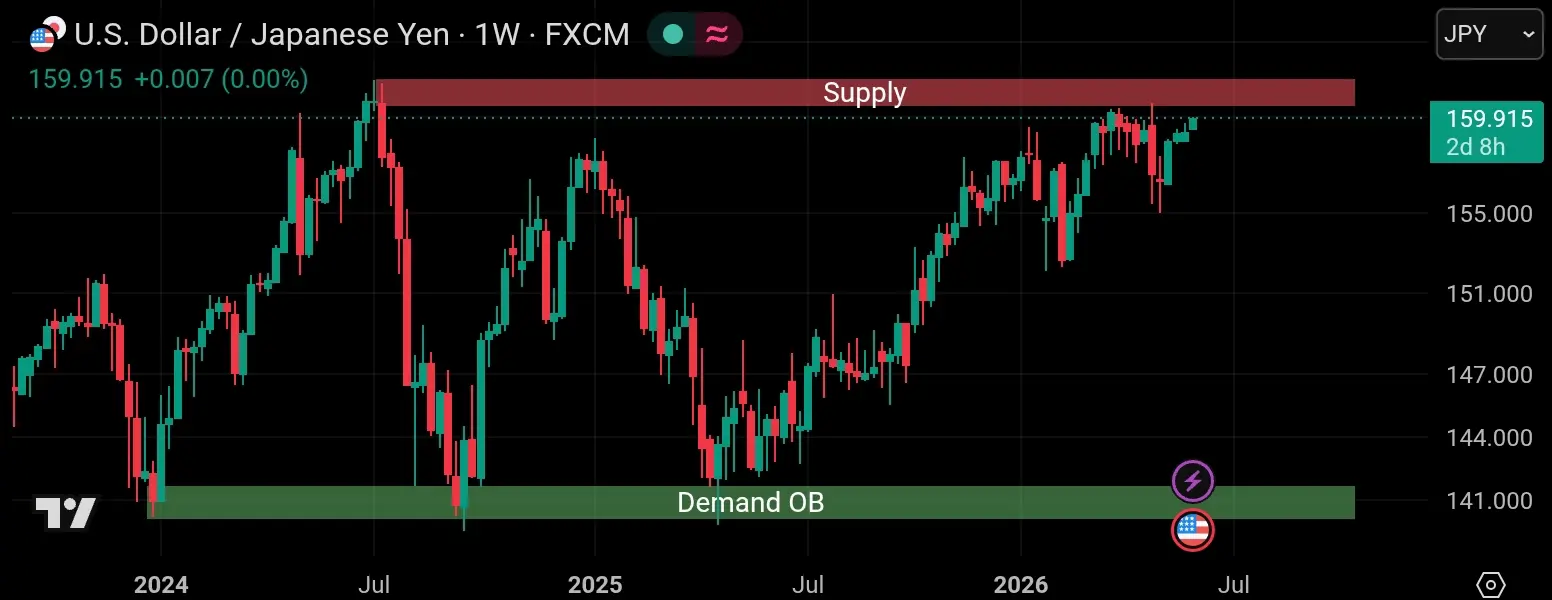
- The Weekly View: The trend is clearly bullish. My eyes are on the support zone between 141.750 and 140.070. On the top side, if we break through, we could be looking at 162.080.
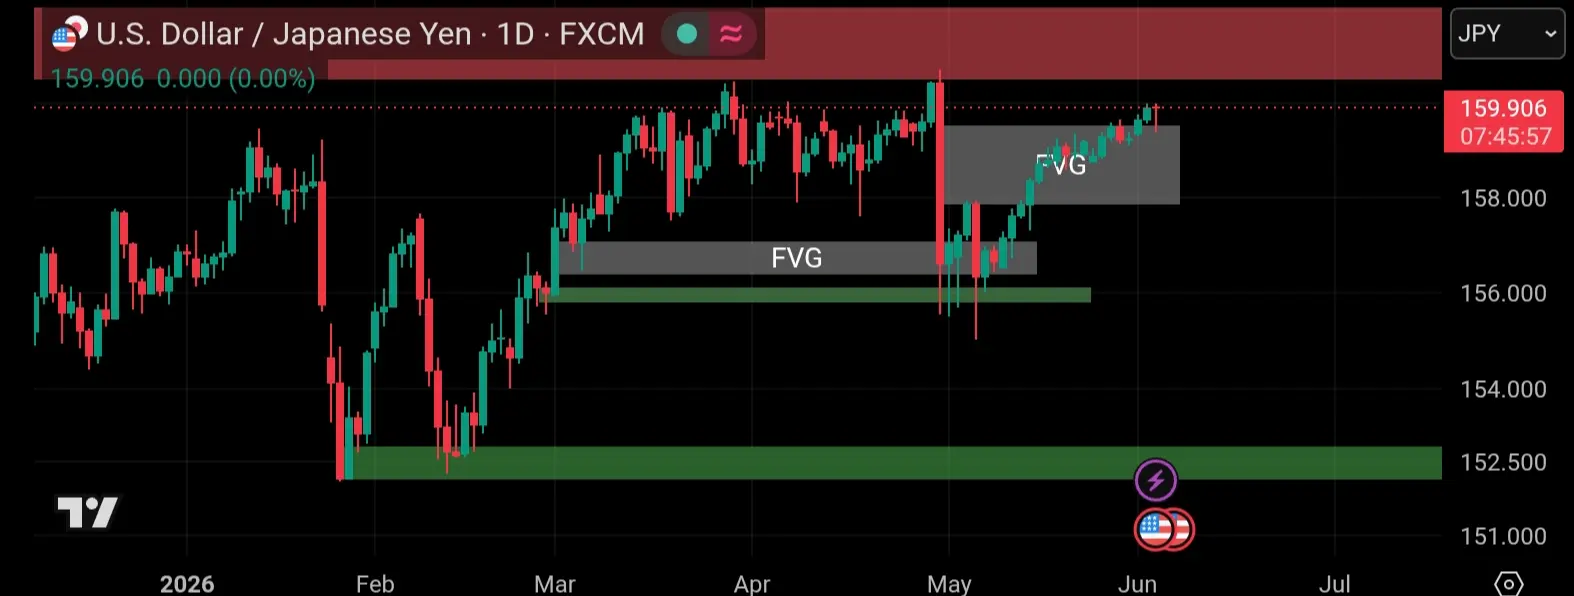
- Daily Patterns: Demand is holding strong at 152.770. I am also watching the 156.220 level as a local support, just in case things get shaky.
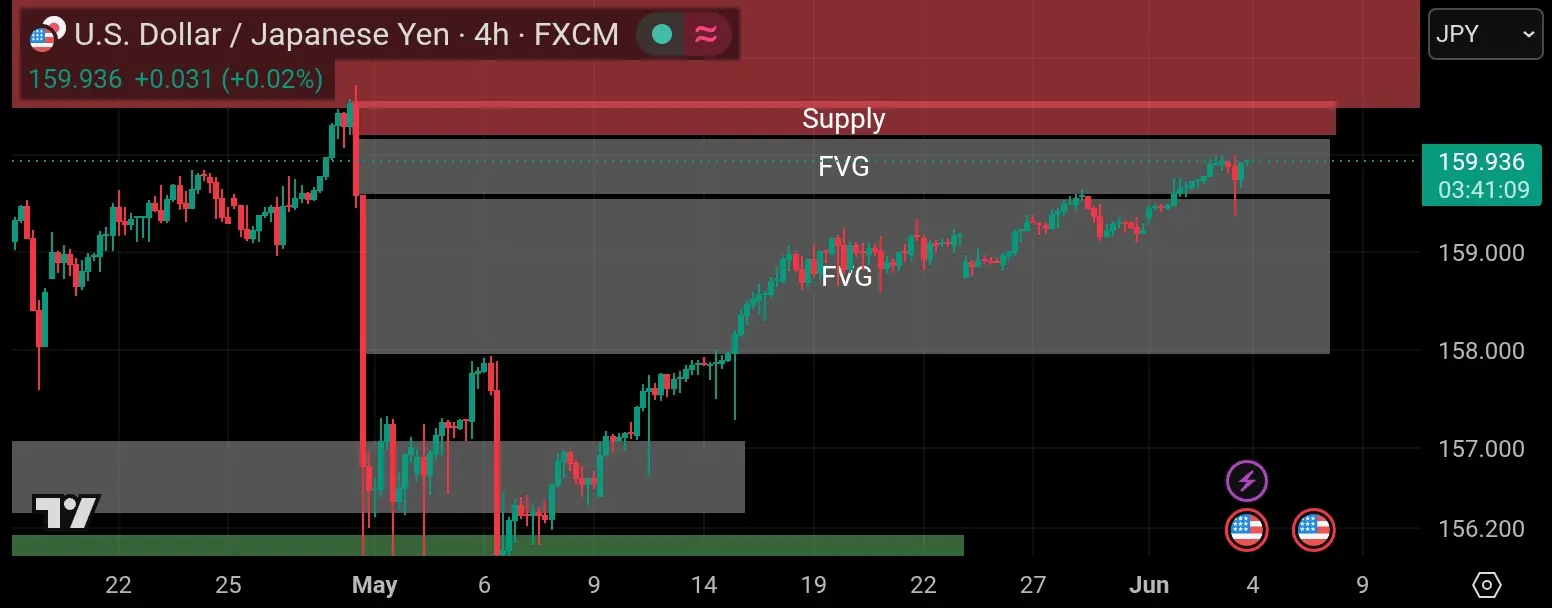
- The 4H Action: We are still in an uptrend, but I am starting to see some selling pressure. Those red candles on the 4H chart are a bit of a warning sign for me. The price is pushing toward 160.550 right now.
How I Use Confluence
Charts are only half the battle. I also use Fair Value Gaps (FVG) to see where the big players might be lurking.
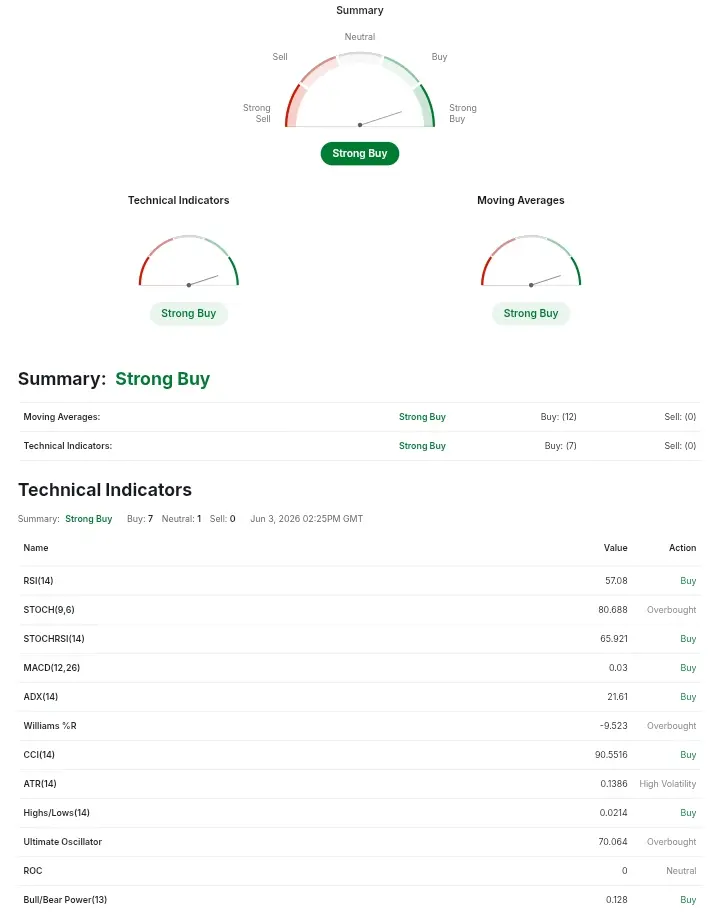
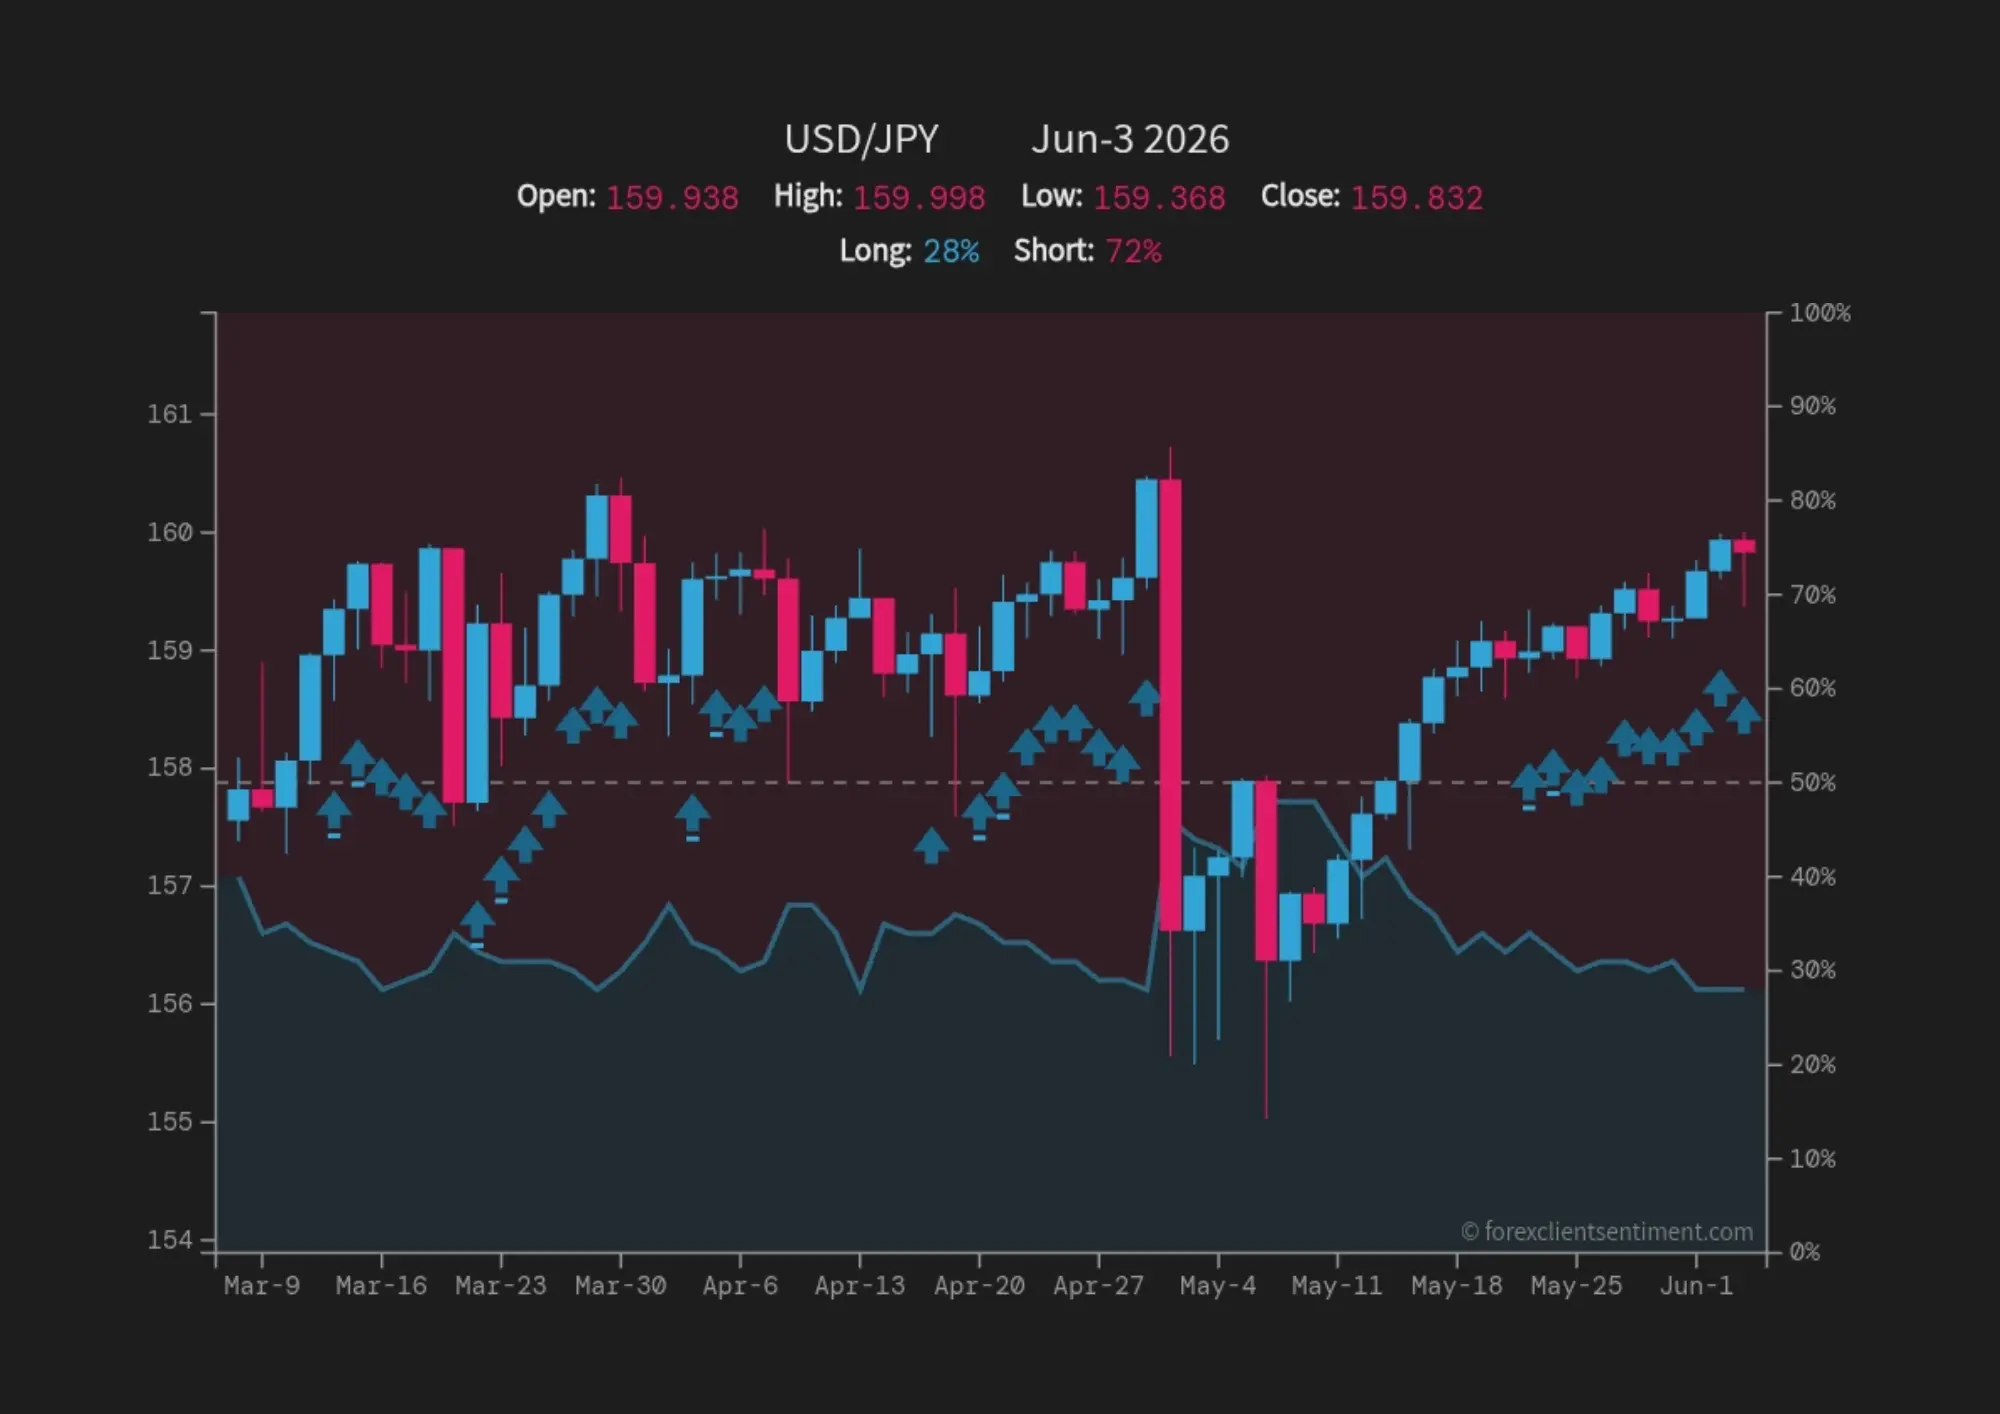
I also like checking the sentiment. The Strong Buy signals are everywhere, but looking at the Client Sentiment, most retail traders are shorting. Whenever I see that, I get suspicious it often means the smart money is about to squeeze us out.
One Last Thing
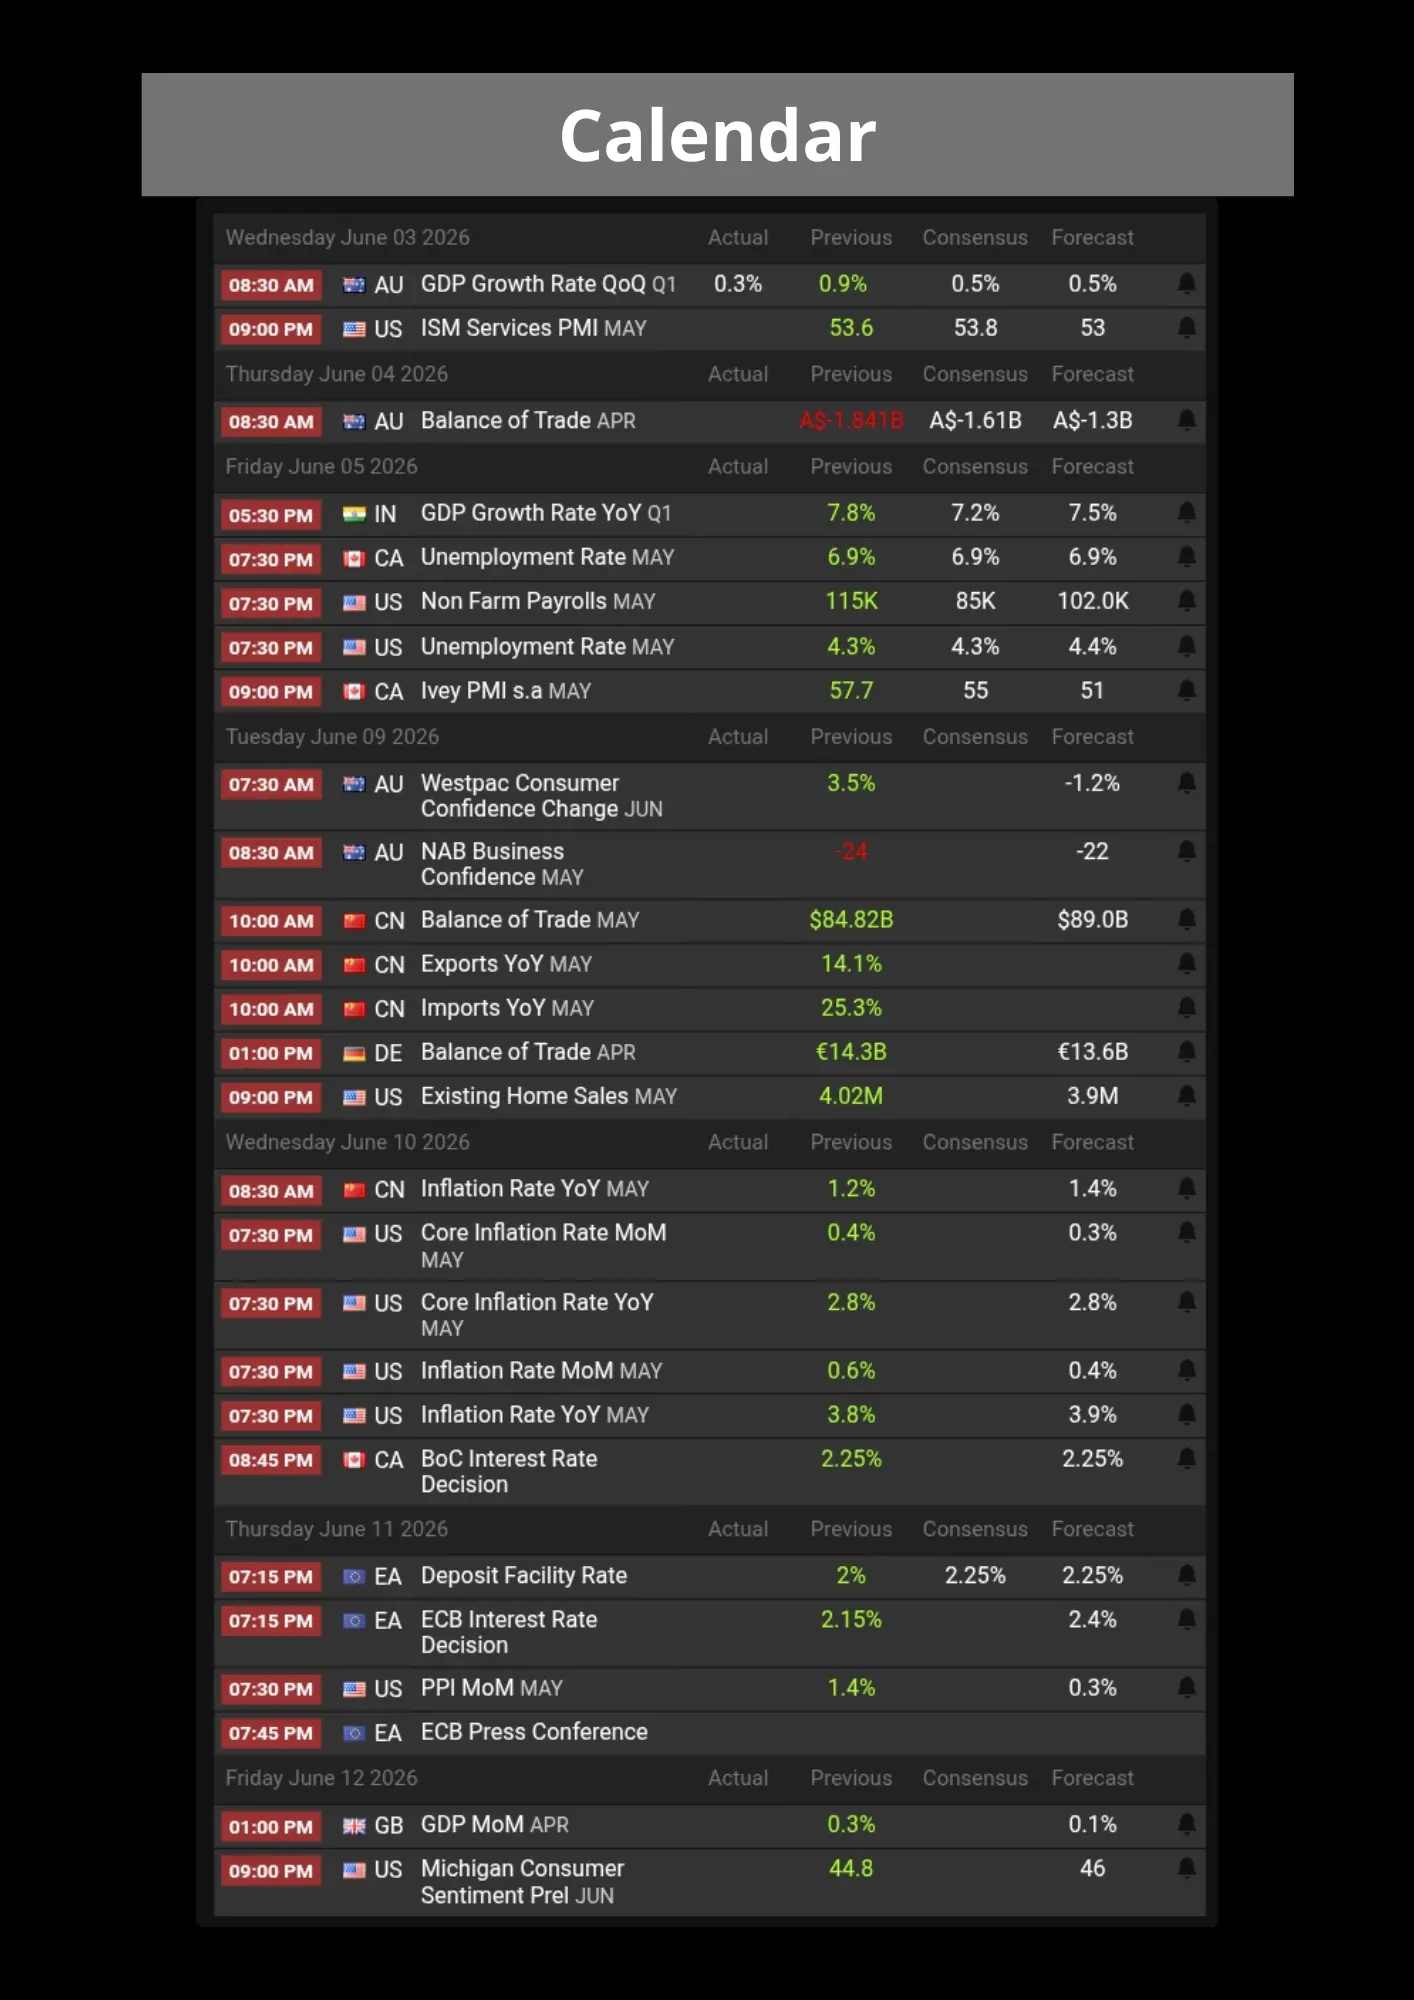
Before you trade, please check the economic calendar. I have seen too many setups get destroyed by high impact news data.
My Trading Plan
I am not going to fomo into this. Chasing resistance at 160.550 feels like a trap. I prefer to wait for a pullback. If we dip back to 156.220, that might be where I start looking for a real setup. Remember, capital preservation is the goal. Don't go crazy with leverage.🫵💸
Click here to read my authentic and original analysis
⛔ Disclaimer: This article is strictly for informational and educational purposes only. It is not intended as financial advice, and I do not provide any trading signals. All investment decisions are your sole responsibility. Please ensure you conduct your own research (DYOR) before making any trades.






