
Let's look at LTC /BTC Daily Chart 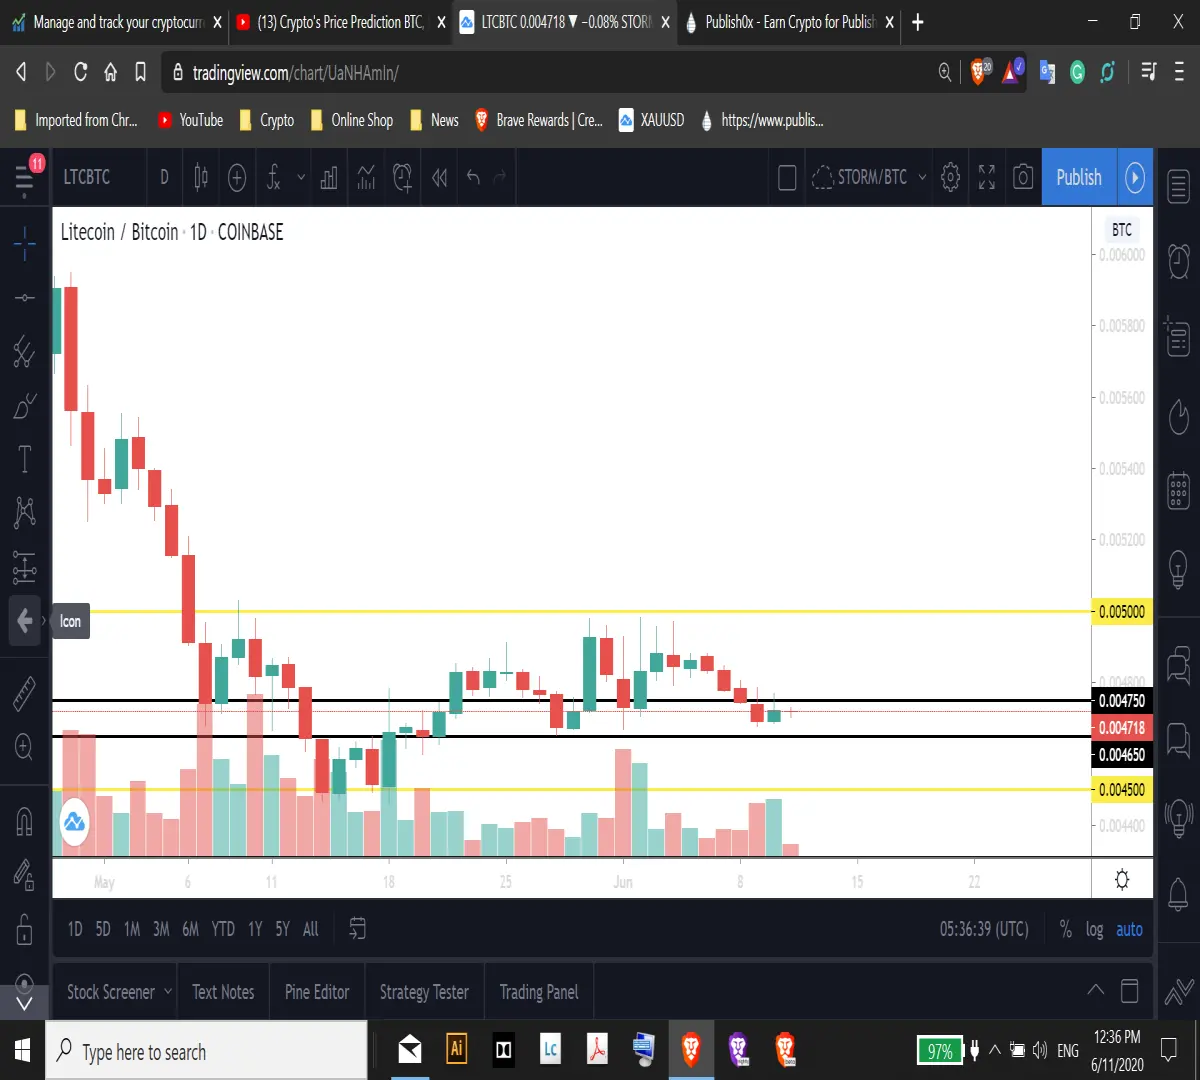
LTC is moving sideways long time between 0.0050 BTC and 0.0045 BTC range as you have seen it is indicated with yellow lines and it would really take some time and volume to push the price upper end of these lines.
Definitely weakness came to LTC again and volume is down and resistance is 0.004750 BTC level and support stays at 0.004650 BTC level.
We have to really watch BTC prices, if big jump on the price then it would see a sharp decline in the price in at a short time.
Install BRAVE Browser and earn BAT tokens for surfing
https://brave.com/bab738





