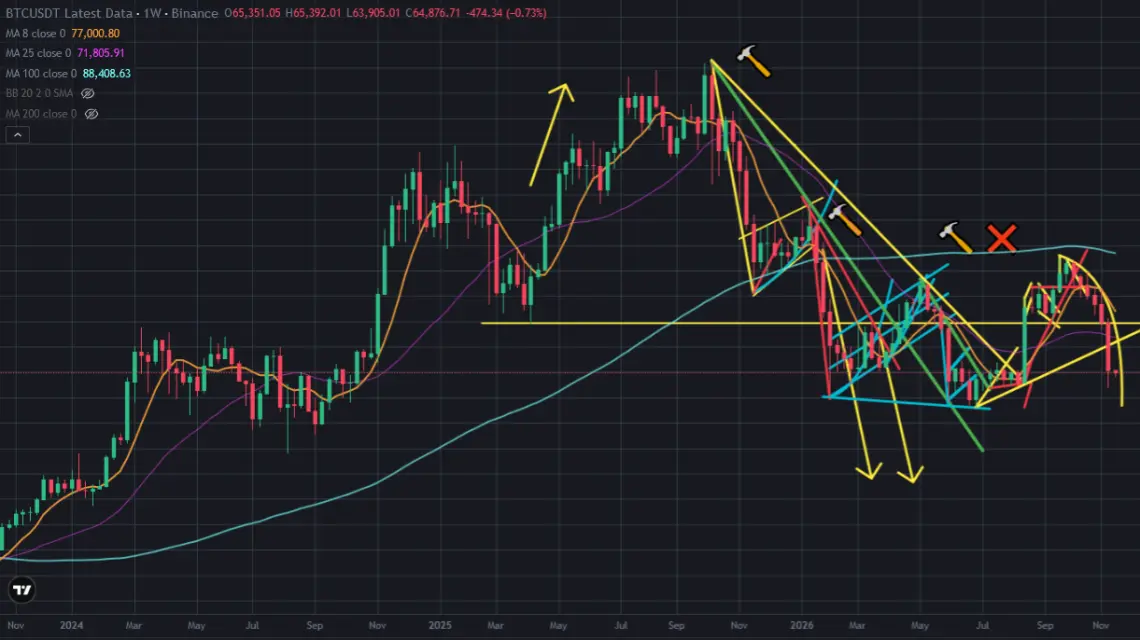
We are in one of the longest weekly red candles serie on Bitcoin price chart. Bitcoin price is in 7th weekly red candle. There wass curve resistance on Bitcoin price chart. I pointed this possible curve resistnace in 3rd weekly red candle. I shared a few analysis and pointed possible weekly red candle serie on Bitcoin price chart and It happened.
Here you can see weekly chart of Bitcoin price. There was young uptrend line on Bitcoin price chart. It is broken down with 6th weekly red candle. There is no uptrend line on Bitcoin price chart. We will try to find the bottom on Bitcoin price drop.

Here you can see the indicators on weekly chart of Bitcoin price. Fisher Indicator is going down. It is close to the bottom. It may reverse up in a few weeks if we see weekly green candle on Bitcoin price chart.
MACD Indicator reversed down. It may take a few weeks to reverse up. There was great downtrend line on RSI Indicator. Bitcoin broke up this great resistance. Even it is broken up, we have not seen enough price pump on Bitcoin price chart. There is uptrend line on RSI Indicator. Bitcoin price may touch this uptrend line and It may be supported by this support.

Bitcoin price may be close to the bottom. We may see triple bottom pattern on Bitcoin price chart. We need a few weeks to see reverse up.