
I'm directly referring to the first article today for introduction. For the first time I wrote about BTC before ETH, sorry for the crime !
As I am preparing myself for a long term investment and not an intraday, I'll start my analyse of the current situation on the weekly chart. Just a short reminder referring to the article Crypto Switzerland FAQ and strategies, when you decide to invest into any forex/stock, always decide the time unit (TU) you want to invest in (daily term in the case of this article), then analyse a bigger TU to identify the trend (here I chose weekly), and then only decide your entries and exits on a smaller range (4h/240min in my case).
Weekly

First when we look at the weekly graph, what we can see is that last week ended up badly, but it actually just continued a pattern that was founded in the beginning of July this year. We assisted a third fall and may have a new market compensations for the following weeks, or a new bull, we never know...
Daily

While it invalidated the double bottom, price also has been rejected by SSB D and jumped back into its parallel channel. What is interesting is that the old double bottom closure made up a support that has now changed into resistance to the price. Let's see how long it can last...
Anyway, I wouldn't bet on any long term bull run until price successfully closes above SSB D. And even though it climbs upon SSB D, I'll stay really cautious with SSB W right above it.
Intraday - 4h/240min
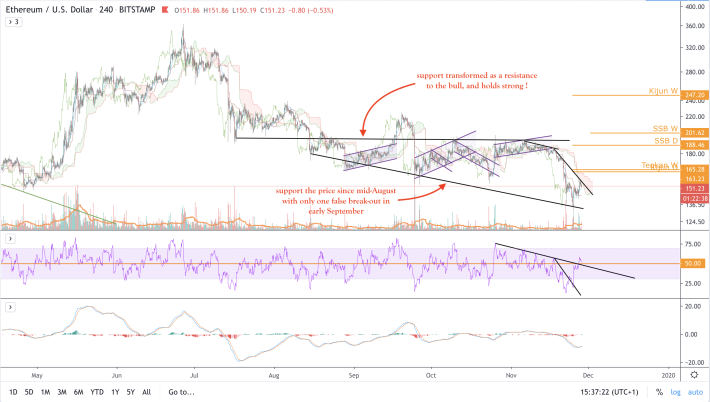
On a shorter TU, The price came to land very nicely and precisely on the existing support that does its job with only one failure around early September this year. Also, highlighted above we can see the resistance the price must break before entering any bull run. Let's keep in mind that it succeeded once but was rejected by SSB W by the end of September. This showing the importance of this resistance.
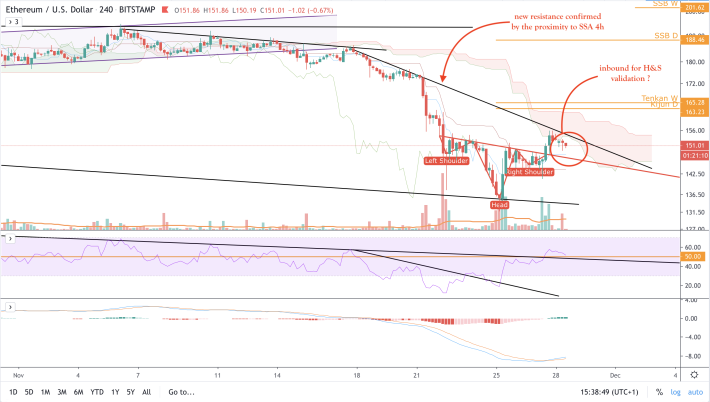
On a closer view we can see a possible validation of the H&S formation coming in the next few hours for those who like to play short. Chiku Span offers the exact space it needs between the two shoulders to jump down and come back up, price has just been rejected by the cloud and could land on the neck line before climbing into the cloud again. This confirming the potential short term position.
Conclusion
As always we can find some short term position in the way, but at this point of the market and as we're closing end of year, this isn't the movement I am looking for. I am definitely waiting for the long term positions. With that objective, those are the signals I am looking for :
1. Price closing above Ichimoku's Cloud 4h and Kijun D as an entry signal
2. Chiku Span 4h crossing the cloud as a reinforcement signal
3. Positively closing above SSB D (twice if volumes aren't high or only once in the contrary)
4. Price closing above SSB W to reinforce very long shot
And just to play a little and train the skills : playing that short H&S formation
We hope you like all those good news and will be happy to share and talk with you anytime !
Stay up-to-date on the free telegram channel in case of any emergency alert : https://t.me/BlessPatrickCryptoSwitzerland
If you like the articles please don't hesitate to tip as this encourages me to go further and share as much as I can. I am also open to any request on any analysis.


