
Weeks ago I sent a review that talked about price rejection to 6'500 $, this was in the following article published on 12th of October : BTC/USD - Very large market review. Some people contacted me trying to tell me I was wrong. To tell the truth, I was hoping they were right... But now here we are with the lowest y-to-D price the 25th of November between 06.00 and 06.30 (Swiss time) at exactly 6'515 $.
But there's not interest in saying who were right or wrong. Question now is : where're we at now and where are we going ?
As I am preparing myself for a long term investment and not an intraday, I'll start my analyse of the current situation on the weekly chart. Just a short reminder referring to the article Crypto Switzerland FAQ and strategies, when you decide to invest into any forex/stock, always decide the time unit (TU) you want to invest in (daily term in the case of this article), then analyse a bigger TU to identify the trend (here I chose weekly), and then only decide your entries and exits on a smaller range (4h/240min in my case).
Plan
- Weekly
- Daily
- Intraday
- Conclusion
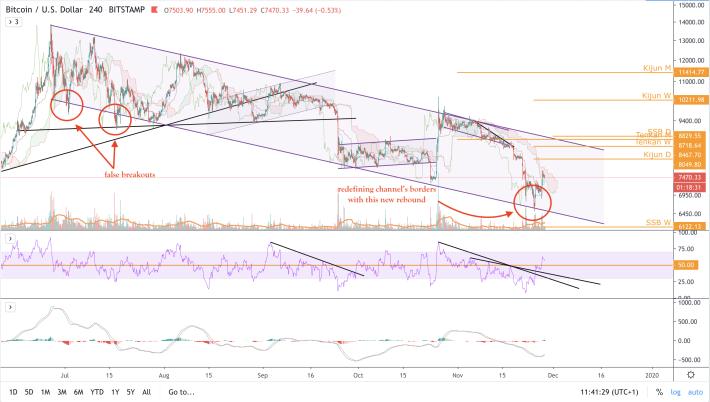
Weekly
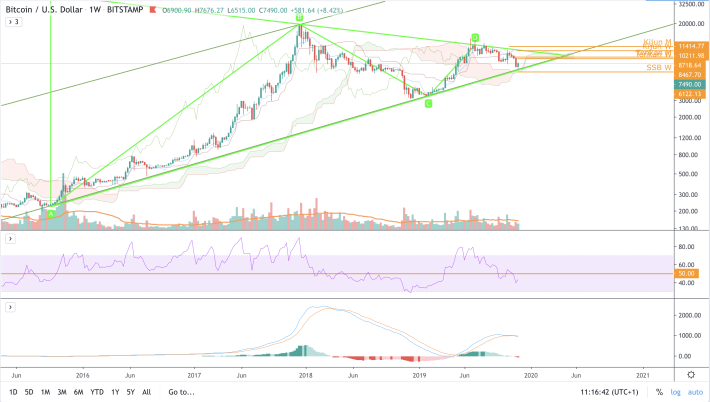
What we may see here is that price has just confirmed with a very nice 5th touch the upward channel. We also can see that as it wasn't able to step out of this triangle between half and last third of the triangle, it may lose some power on the out-breaking and not confirm it completely on the long term. But still it should explode its price following the upward parallel channel (we're talking very long term here).
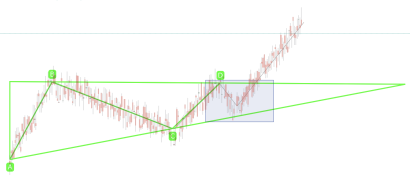
just a very small reminder concerning the triangle formation. On technical analysis it gets its max power when price step out between 1/2 and beginning of the last 1/3 of the formation. It corresponds to the grey zone drawn on that figure.
Here there's one information that doesn't confort me totally. Price rebounded this week on SSA W which is good, but it looks like it prefers to try to close way above (we'll have to wait for the end of the week to confirm this information). This could be any good or bad.
It could be a good sign as it may show a strong movement that doesn't need its support to begin. This theory would totally correspond to an equivalent growth to the steep SSA that could lead the way in the next weeks.
Or it could be bad as the market could want to close on its support as it did each previous time, and then we're not over yet with the bear market.
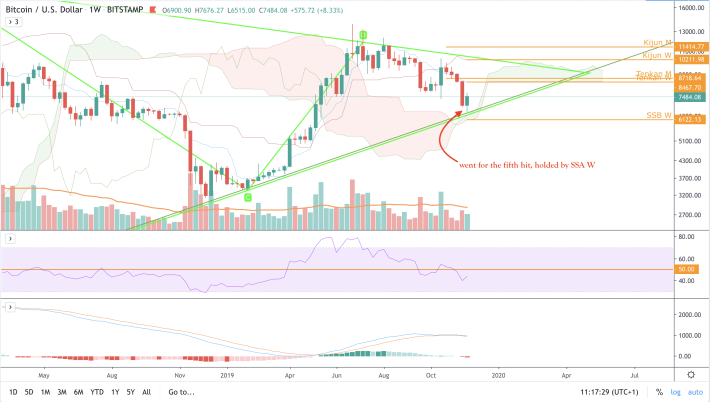
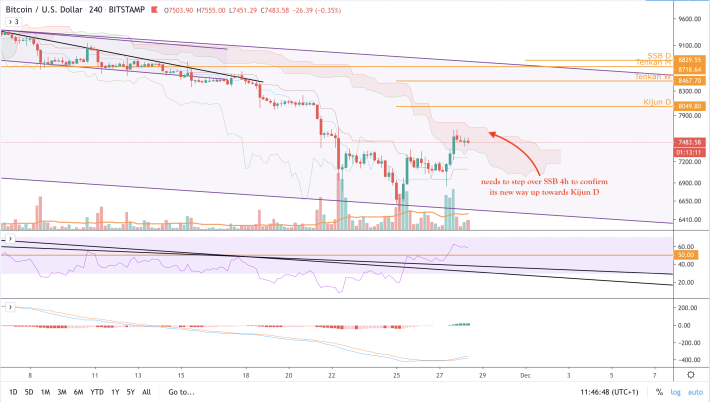
Daily
On the daily term price followed its descending trend line and could be forming a cup & handle formation. In that case, I would say we should come to the top of the small handle and join the bear again. This would confirm the weekly bad point.
On Ichimoku's side, price managed to jump above Tenkan D. I would take it as an entry sign as the trend is not positively designed for now. On the daily term I would wait for the price to close over Kijun D before taking any large position.
Intraday - 4h/240min
The actual rebound redefined channel's border, and it confirmed. I'm still not sure if this rebound was the ultimate one if we refer to the weekly/daily analysis.
The question is when is a good time to answer. As in any correction, there're lot of opportunities you can exploit. We can see a H&S formation, typical counter movements in three candles, etc. But as I am preparing resources for a long term investment, I won't play too much on them. Maybe only some small positions for the fun but nothing important. What I am waiting before investing is the price confirming a new position above SSB 4h.
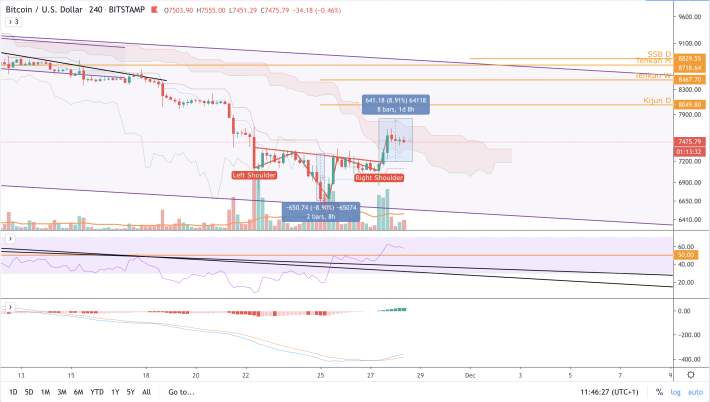
This figure is really important as it may confirm the movement is still not ready for a new short term bullish market. Price formed a very nice H&S but hardly confirms it with the impossibility for now to bring back the 8.9%. Also, despite a H&S that is usually strong, price is retained into Ichimoku's cloud without even closing to SSB (for now...).
Conclusion
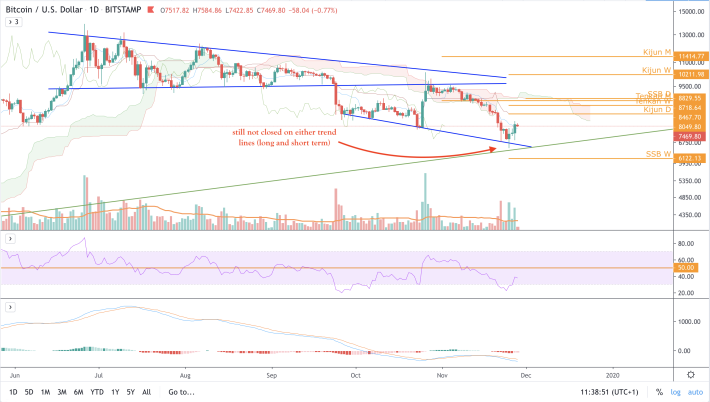
We can see from the shortest TU to the longest ones that the market is trying to fight but still isn't convinced by its ability to build a new bullish trend. Also, since the 26th of June it didn't climb above the downward parallel channel, and at the moment it tries a H&S formation, it is unable to confirm it. The following signals will be the ones I'll use in the next move :
1. Closing price above SSB 4h as first entry point
2. Closing price above Kijun D as signal for position consolidation
3. Closing price above SSB D/parallel channel as full entry for a new long term bullish trend
We hope you like all those good news and will be happy to share and talk with you anytime !
Stay up-to-date on the free telegram channel in case of any emergency alert : https://t.me/BlessPatrickCryptoSwitzerland
If you like the articles please don't hesitate to tip as this encourages me to go further and share as much as I can. I am also open to any request on any analysis.


