
Greetings! In this article, I will go over my technical analysis I did today and explain what indicators were notable and future potential scenarios of the Bitcoin price action.
What's next after today's dump?
Today, Bitcoin dumped as low as 26.5k before recovering to the 26.8k price regions. Despite this being generally bearish for Bitcoin, according to the technical indicators in the various time frames, Bitcoin is surprisingly neutral.
4-hour time frame:
In the 4-hour time frame, the RSI is at oversold territories now and the MACD has a high potential of forming a bullish cross within the next few days or so. Both of these indicators shows that Bitcoin, within the next couple of days, is relatively bullish. Furthermore, in terms of candlestick patterns, there is one .382 candle that recently formed, which indicates that bearish momentum is somewhat slowing down. However, despite these overall bullish indicators present in the 4-hour time frame, it is important to look further to larger term time frames.
24-hour time frame:
In the daily time frame, the RSI is in neutral territories and the MACD is still just beginning its bearish move, of which was confirmed by a bearish cross two days ago. While this is relatively neutral indicators (The MACD is most likely going to go into a lighter downside move due to the bullish nature of the 4-hour time frame), Bitcoin is still lower than all the EMA support regions (200, 50, and 20). This means that if further dumpage is to come, the next support region is the 26k region. However, at the same time, Bitcoin's highest price target if it goes to the upside will most likely be the 27.3k levels of resistance (Due to lacking enough bullish momentum).
Weekly time frame:
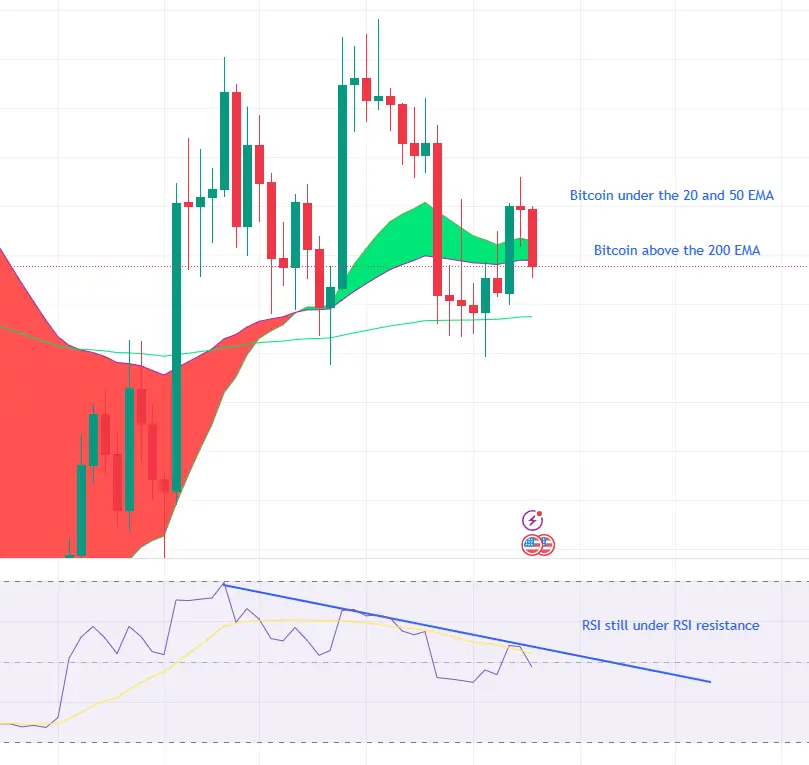
In the weekly time frame, the RSI is in neutral territories, however, it is still within the RSI resistance that it has been in for the past couple of months. Additionally, the MACD is still within the red territories, however, the bars printed are currently pink rather than red (Which indicates that perhaps, the downside is ending). Furthermore, Bitcoin is currently above the 200 EMA support region, but below the 20, 50 EMA regions. Overall, all these indicators mean that we could be either seeing higher price targets in the future or see Bitcoin enter a sideways range between 25k-28k for the next few months (Until a bullish/bearish catalyst effect the price).
Conclusion:
In conclusion, Bitcoin looks surprisingly neutral, with it having both bullish and bearish indicators. Furthermore, Bitcoin is showing strong signs of a pump in the 4-hour time frame, which means that the 24-hour MACD is also going to remain printing small red bars. These indications will also effect the daily MACD to have smaller red bars, which in turn means that the RSI will slowly get reset while the price remains relatively stable.





