The crypto market is going through one of its weakest phases of the year, with Bitcoin and Ethereum down once again and widespread selling across the board. The fourth quarter is also proving to be very heavy for almost all tokens in the Top 20. Outflows from spot ETFs have continued unabated since the beginning of November, while investor fear has now remained at extreme levels for eight consecutive days.
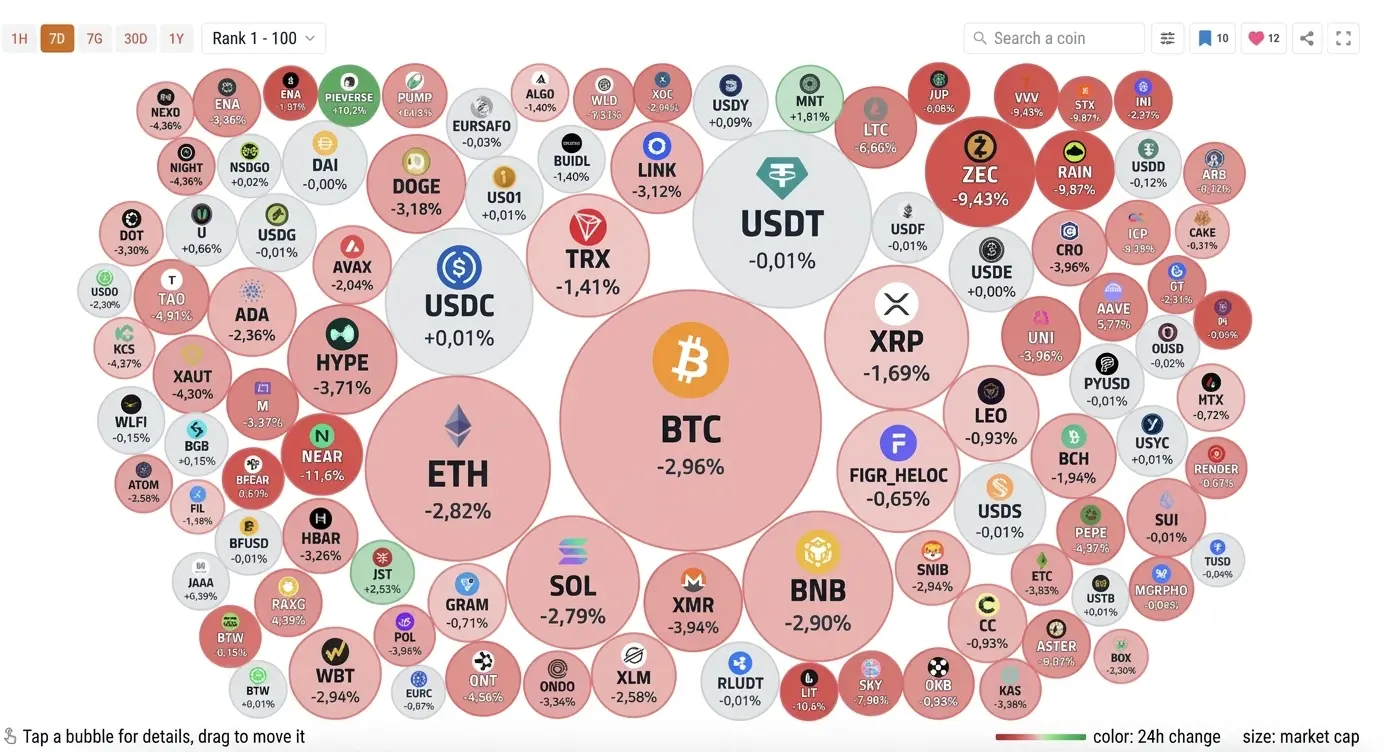
Over the past 24 hours, bearish pressure has hit most of the top 100 spots on the market. The picture isn't entirely negative, as Pieverse is up +10.3%, JUST advances +2.53%, and Mantle rises +1.41%. On the flip side, double-digit drops stand out for Jupiter at -14.6%, LayerZero at -12%, and NEAR at -11.6%. The downturn also affects Zcash at -9.43% and Litecoin at -6.06%, sparing almost no major project. At the time of writing, the price of BTC ($61,580, ▼ -3.54%) and that of Ethereum are also retreating.
Q4 in the red for the Top 20 cryptos
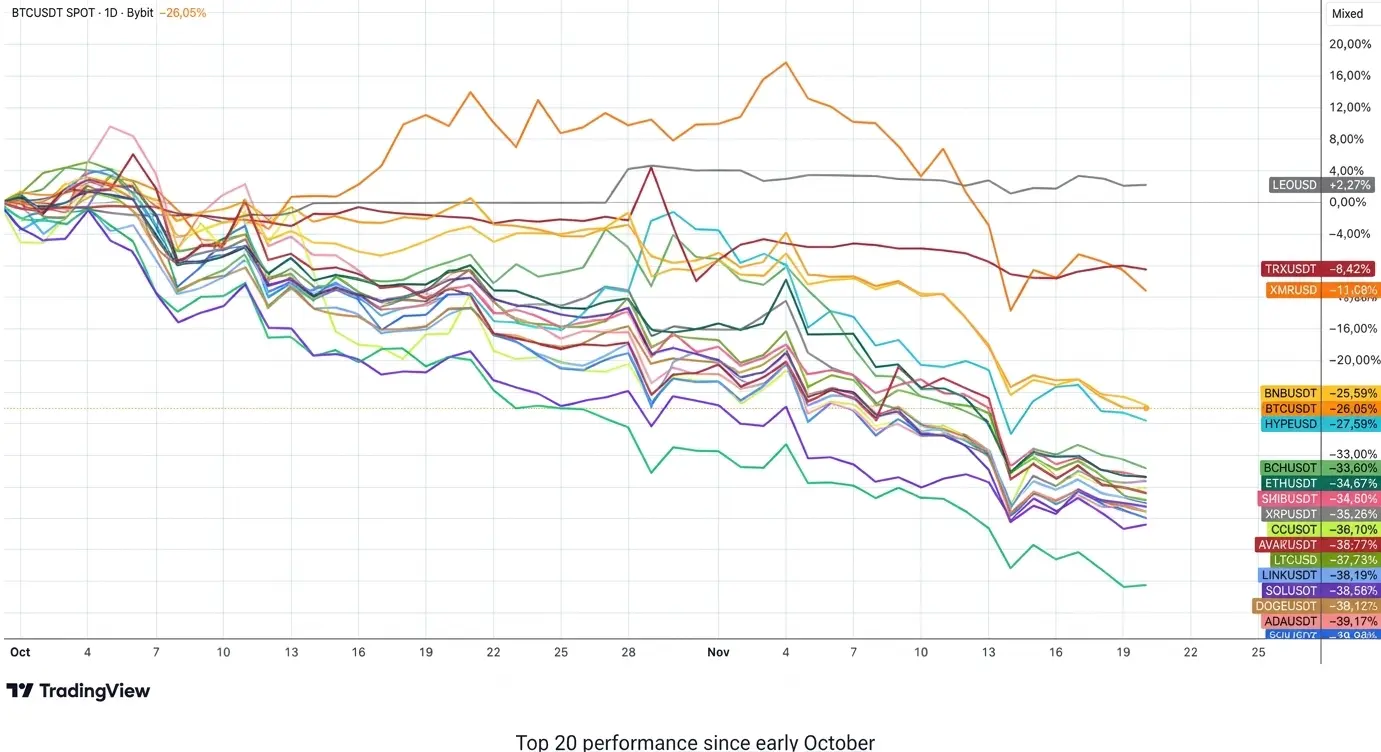
The weakness of the crypto market is emerging clearly in the fourth quarter among the Top 20 tokens by market cap. Since the beginning of October, the only one in positive territory is UNUS SED LEO, with a +2.27% gain. The second-best performing token is Tron, at -8.42%, though it remains the only one on the list up in November with a +1.81% increase. For the rest, it is a long string of red numbers, from Bitcoin hovering around -26% and Ethereum at -34.67% to Sui nearing -40% in just over a month and a half. The chart shows the widespread downtrend at a glance.
Following yesterday’s drop, the crypto market cap is hovering around $2.1 trillion. Year-to-date losses exceed $830 billion, down -28.33%. Compared to its peak of $4.27 trillion, the total market value has now been cut in half.
Spot ETH ETFs in the red for nearly all of November
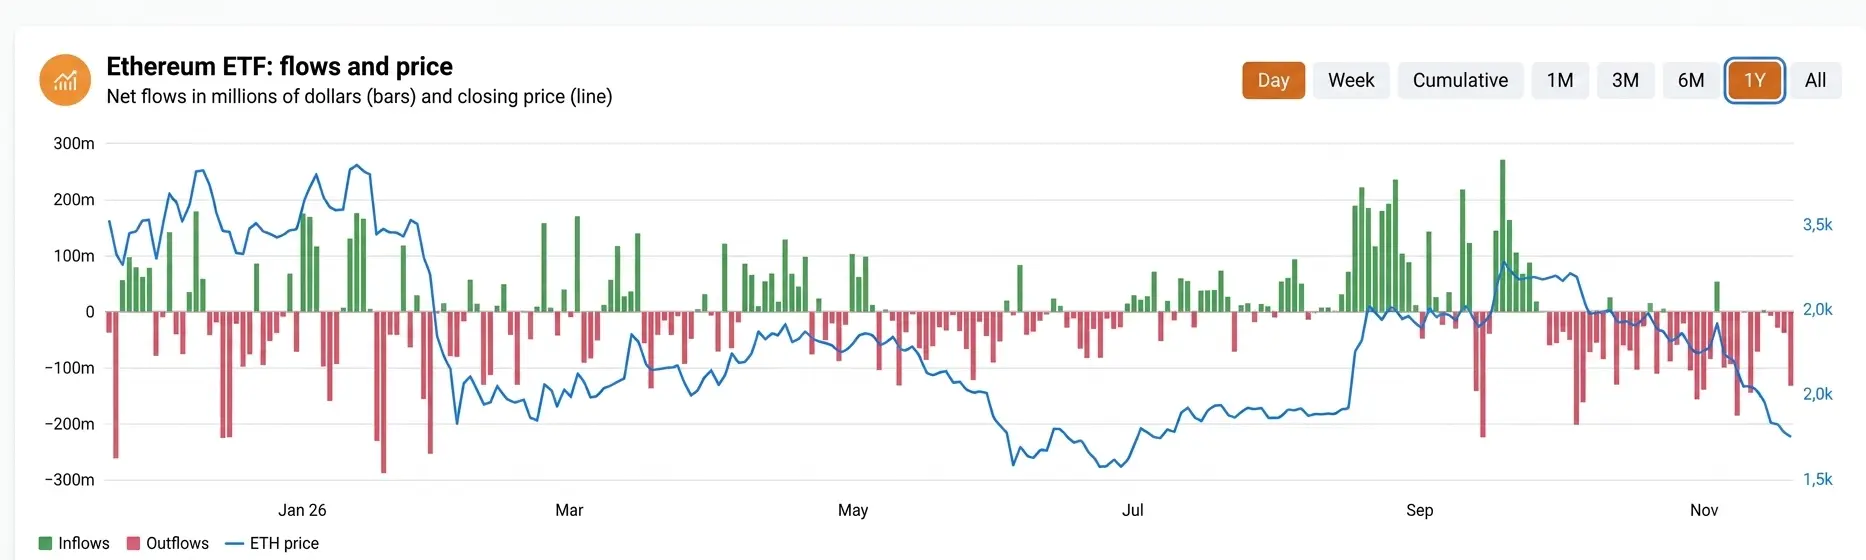
Spot ETH ETFs have experienced an almost entirely negative month, with net redemptions across the vast majority of sessions. Daily outflows have frequently fallen in the $100 million to $200 million range, while days with net inflows can so far be counted on one hand. The flow chart shows how institutional demand—which had supported the price recovery in September—has dried up in a matter of weeks. As a result, Ethereum's price has completely given back its autumn gains.
Extreme fear on the Fear and Greed Index
The Fear and Greed Index stands at 12 today, deep in extreme fear for the eighth consecutive day. The indicator sums up investor risk appetite in a single number, and readings this low point to a phase of strong risk aversion. The current level is not far from the annual low of 5 points hit in late February.
Over the past twelve months, the index has spent 44% of the time in extreme fear, compared to 21% across its entire history since 2018. However, the record remains that of 2022, with an uninterrupted streak of 74 days between May and July. Widespread selling, ETF outflows, and depressed sentiment paint the picture of a market still searching for equilibrium.