
Howdy!
Today I would like to discuss something extremely interesting that has popped up on my radar with a few certain coins.
The thing that these coins have in common is the fact that they were eating dirt during 2018 until late-2019 as they tanked from their respective all-time highs and entered the cold Cryptocurrency Winter. However, unlike a lot of altcoins today, these coins also managed to survive this cryptocurrency winter and have started to enter what I like to call “The Recovery Phase”.
If you have been in cryptocurrency for a period of time I am sure you have come across the following chart that depicts the phases of a market bull/bear cycle;
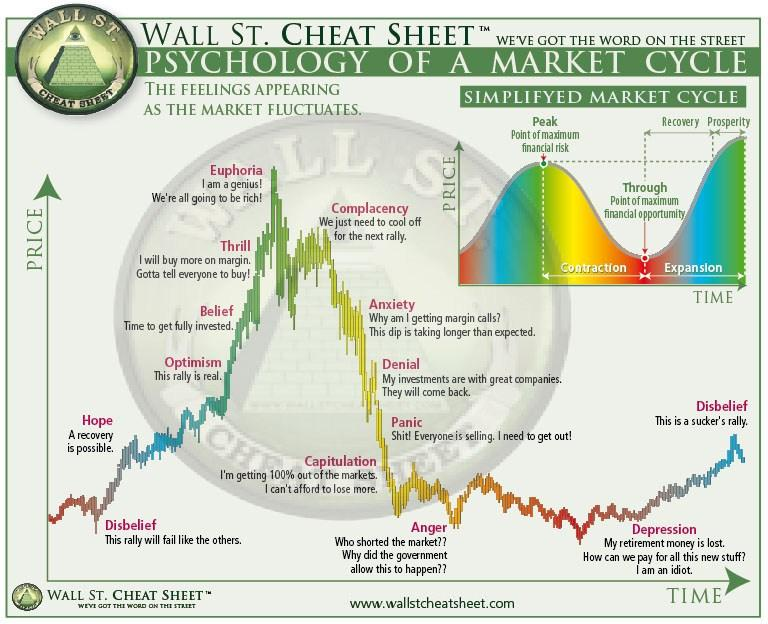
This infographic clearly shows all the emotions that traders and investors feel through each cycle of the bullish run higher and the bearish run lower. However, unless you really look closely at the live market charts, it is really difficult to see this sort of pattern.
This is what I plan to do today.
I want to show you 4 coins that are on my radar that went through the market hype in early 2018 and went on to eat dirt after this as they went into the crypto winter and traded as flat as a pancake.
However, the thing with these coins is the fact that they are starting to show signs of recovering. You could say that these coins might be in the “disbelief” phase as shown in the infographic above.
The reason that most people fail to spot these early signs of recovery is that they never look closely enough. People tend to look at the all-time charts and see that the market is still as flat as it has been since 2018. However, when you zoom in a little closer, your perspective begins to change and you can start to notice the “Recovery Phase” pattern forming.
Kyber Network

KYBER NETWORK - CHART FROM DECEMBER 2017 TO MAY 2020
Looking at the chart above I have outlined the three phases of the market cycle; Hype, Winter, and Recovery.
We can see that the Hype phase saw the price for Kyber soaring almost as high as $6 during January 2018. However, this hype did not last very long at all as the cryptocurrency went on to plummet shortly after. It went on to drop through the first half of 2018 until reaching the $0.80 level during June 2018.
This is when we entered the Cryptocurrency Winter.
During the Crypto Winter, KNC traded between $0.10 and $0.40. It traded within this period all throughout the second half of 2018 and the entire period of 2019.
Toward the start of 2020, we can see the recovery phase starting to form as prices start to marginally increase. It is a little difficult to see this accurately, so let us take a look closer at this recovery phase for a closer perspective.

KYBER NETWORK - RECOVERY PHASE - DEC 2019 TO May 2020
This is the blue zone or “Recovery Phase” from the chart above for Kyber Network.
We can clearly see that the price for the coin started to rise above the $0.25 level during January 2020 and it really started to take off in February 2020 as it climbed above $0.5. In March 2020, the volume started to really surge which pushed KNC well above $0.50 as it reached above the $0.81 level.
This clearly indicates positive growth in the right direction as KNC breaks above the levels it was trapped within during the Crypto Winter.
So, what is going on with KNC?
Well, Kyber Network is an on-chain liquidity tool that allows users to easily swap cryptocurrencies. You can use their protocol to swap ERC-20 tokens with each other as well as with a wrapped version of BTC.
Over the past few months, the DeFi space has really started to gain some solid traction. People are starting to realize the true power of decentralized finance is starting to use it in their day-to-day trading activities.
The chart below shows the total value of USD that is locked away in the Kyber Network smart contracts. We can see that over the past year, the total value that has been locked away has continued to grow from as low as $2 million to as high as $5 million today;

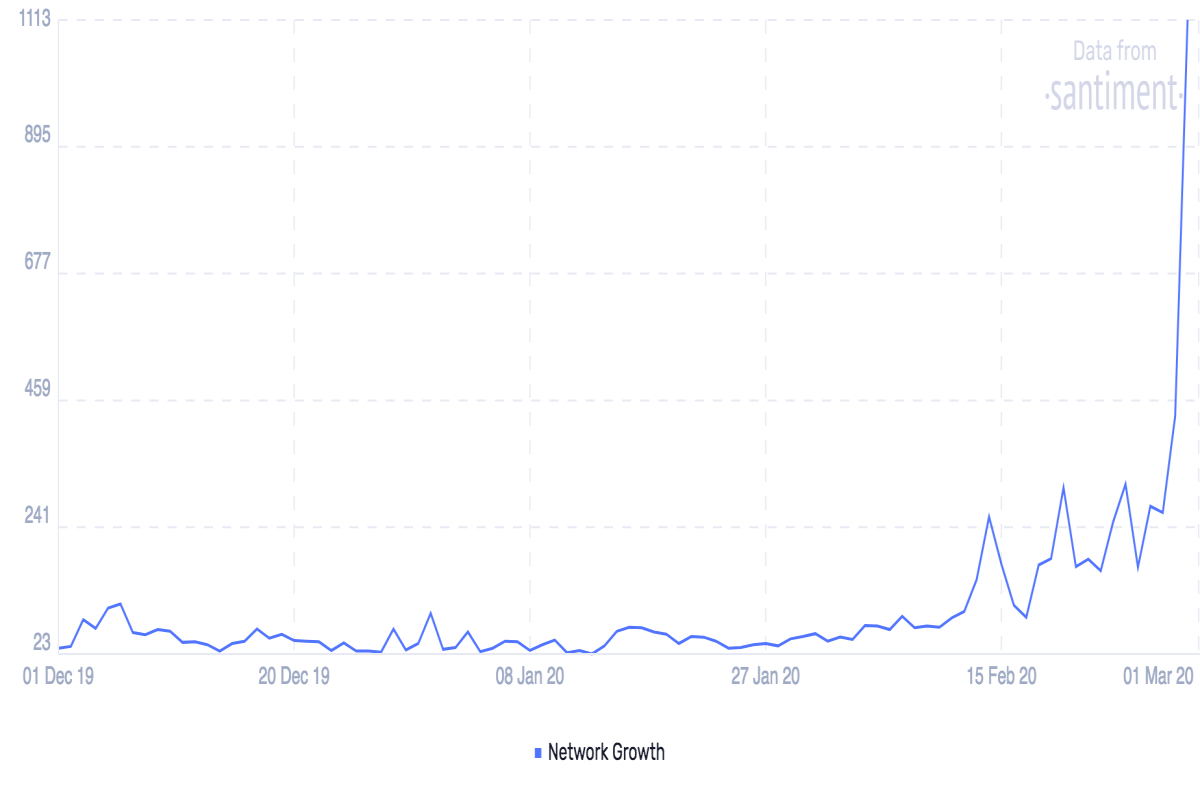
Furthermore, more and more developers are starting to integrate Kyber Network into their own dApps as Kyber makes it extremely easy for developers to do so. This helps the network to gain further traction.
You can easily see this just by looking at the network growth statistic from Santiment which shows that the network growth went through the roof during March 2020;
On top of all of this, there is an upgrade on the way for Kyber Network. Katalyst is expected to be with us by mid-2020 and this upgrade will see some major performance and useability enhancements for Kyber.
All of these factors combined have allowed Kyber Network to survive the Crypto Winter and enter the recovery phase that we are seeing today.
Status
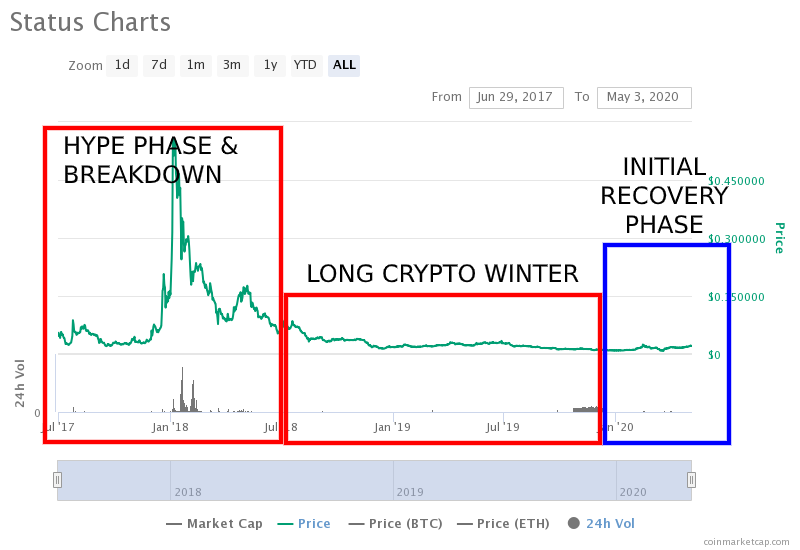
STATUS NETWORK - CHART FROM JULY 2017 TO MAY 2020
Looking at the all-time chart for Status above we can see a similar pattern forming.
The cryptocurrency surged during January 2018 as it entered the hype phase which allowed the cryptocurrency to climb as high as $0.58 per coin. Unfortunately, it quickly started to fall and by July of 2018, it had dropped as low as $0.06 per coin as it entered the Cryptocurrency Winter.
During the Crypto Winter, Status traded extremely flat as it bounced between $0.025 and $0.010 for a period of 18 months or so. It largely remained beneath $0.015 for the majority of this period and only briefly remained above $0.020 for short periods of time.
It started to uptick during February of 2020 as it entered the recovery phase. Let us take a closer look at this for a better perspective.
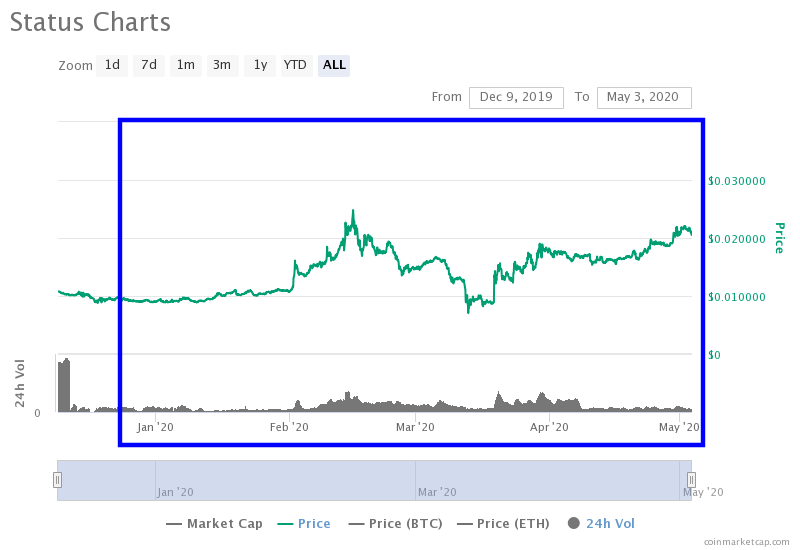
STATUS - RECOVERY PHASE - JAN 2020 TO May 2020
Although Status has not increased too much past the peak of the Cryptocurrency Winter it is certainly showing a higher level of activity as it manages to break above $0.016 in February 2020 and climbed as high as $0.025 toward the middle of the month.
Of course, it dropped lower during the March market collapse that was caused by the Coronavirus pandemic but it quickly recovered in April as it started to trend higher to the $0.024 level where it trades today.
So, what is going on with Status?
Status is an open-source mobile messaging platform that allows users to securely send messages to each other through the power of blockchain technology. However, it is much more than just a messaging application.
The Status application is actually a gateway into Web 3.0 and it allows users to browse and access all of the dApps that are built on top of the Ethereum blockchain itself. This means that users can access these dApps straight from their mobile handsets without even having to open any form of a desktop browser.
Vitalik Buterin, the founder of Ethereum and overall all-round innovator in cryptocurrency, even rates Status highly as he puts it on his list of projects that Ethereum has in 2020 to drive the ecosystem forward that it did not have in 2017.
After years of development, the team actually managed to release the official version of Status 1.0 in February 2020 which brought the project out of the beta stage. You can now download Status on both iOS and Android stores today. The application already has over 50,000 downloads on the Google Play Store which is a momentous milestone to pass for a cryptocurrency project. Most don’t even have 100 users, let alone 50,000.
Loopring
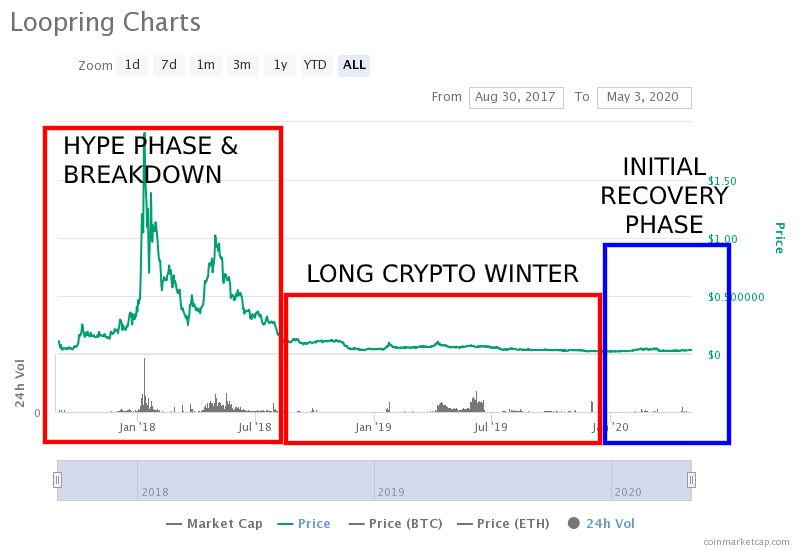
LOOPRING - CHART FROM DECEMBER 2017 TO MAY 2020
Taking a look at Loopring above, we can see that the coin soared as high as $2.18 during the great bullish in January 2018. This hype phase was immense but it broke down as quickly as it went up.
By the time July came around, the price for the cryptocurrency had dropped as low as $0.24 and it continued to drop as low as $0.04 by the time the Crypto Winter started for LRC. It stayed within this sideways, flat, and boring trading movement during the Crypto Winter for almost 18 months - the same period of time as the others on this list.
However, although it might not look like anything from this perspective, it has upticked quite significantly during the 2020 months.
Let us dive a little deeper for a closer look.
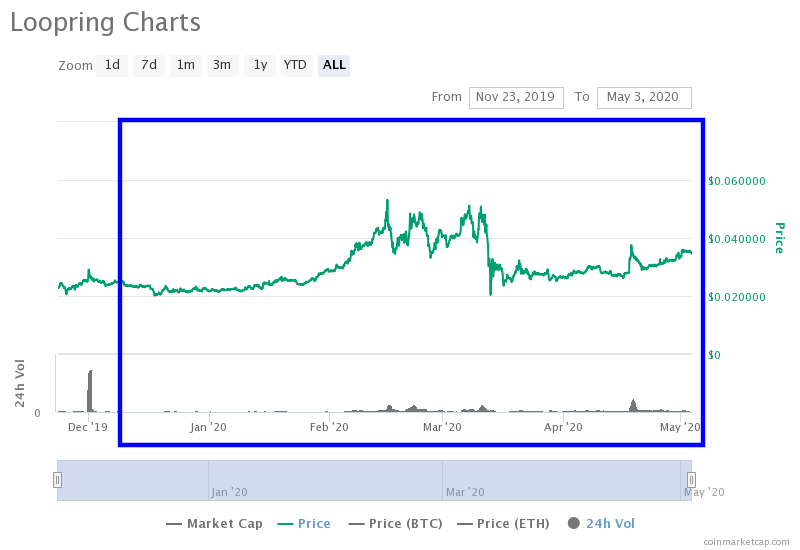
LOOPRING - RECOVERY PHASE - JAN 2020 TO May 2020
Taking a closer look, we can see that during February the price of Loopring soared as it managed to climb as high as $0.53 toward the middle of the month. The March market collapse, caused by the Coronavirus pandemic uncertainty, did push LRC lower as it went back toward the $0.24 level, however, we can see that Loopring is already recovering from here as it reaches the $0.35 level.
This is most certainly a coin that is in the recovery phase.
So, what is going on with Loopring?
Loopring is a decentralized exchange protocol. It is a solution to the problem that we have in centralized exchanges today in the sense that we have to trust them with our funds if we would like to trade on their exchanges. Not to mention the mounting fees that centralized exchanges charge.
There is actually quite a buzz around Loopring, especially since Publish0x recently went ahead and integrated it as a tipping coin within the platform. Personally, I love the fact that Pub0x is adding more coins for us to collect tips in and I am pretty happy that Loopring is one of the options - especially when we consider the amount of growth the coin has ahead of itself.
Loopring allows developers to come and launch their own Decentralized Exchanges (DEXs) on top of the protocol that they have built. This protocol has managed to keep the cost for trading as low as $0.000124 per trade for these DEX owners, which means they can offer highly competitive fees per trade. We can assume that trades won’t be that cheap as they will be charging their own markup for each trade but they will still be very cheap relative to centralized exchanges.
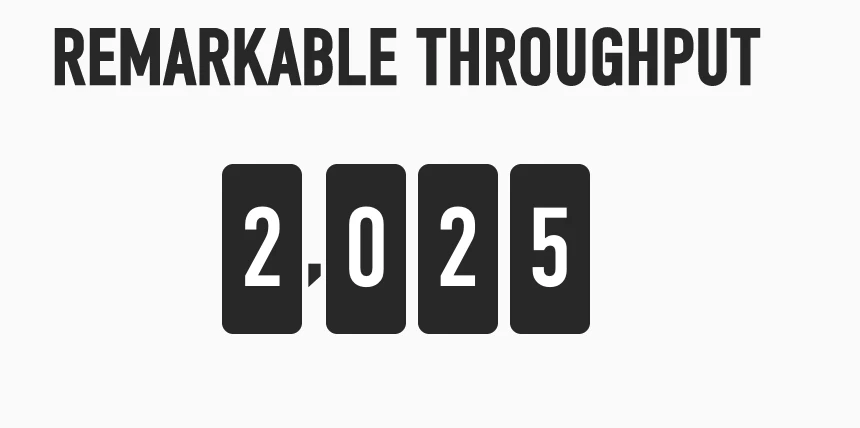
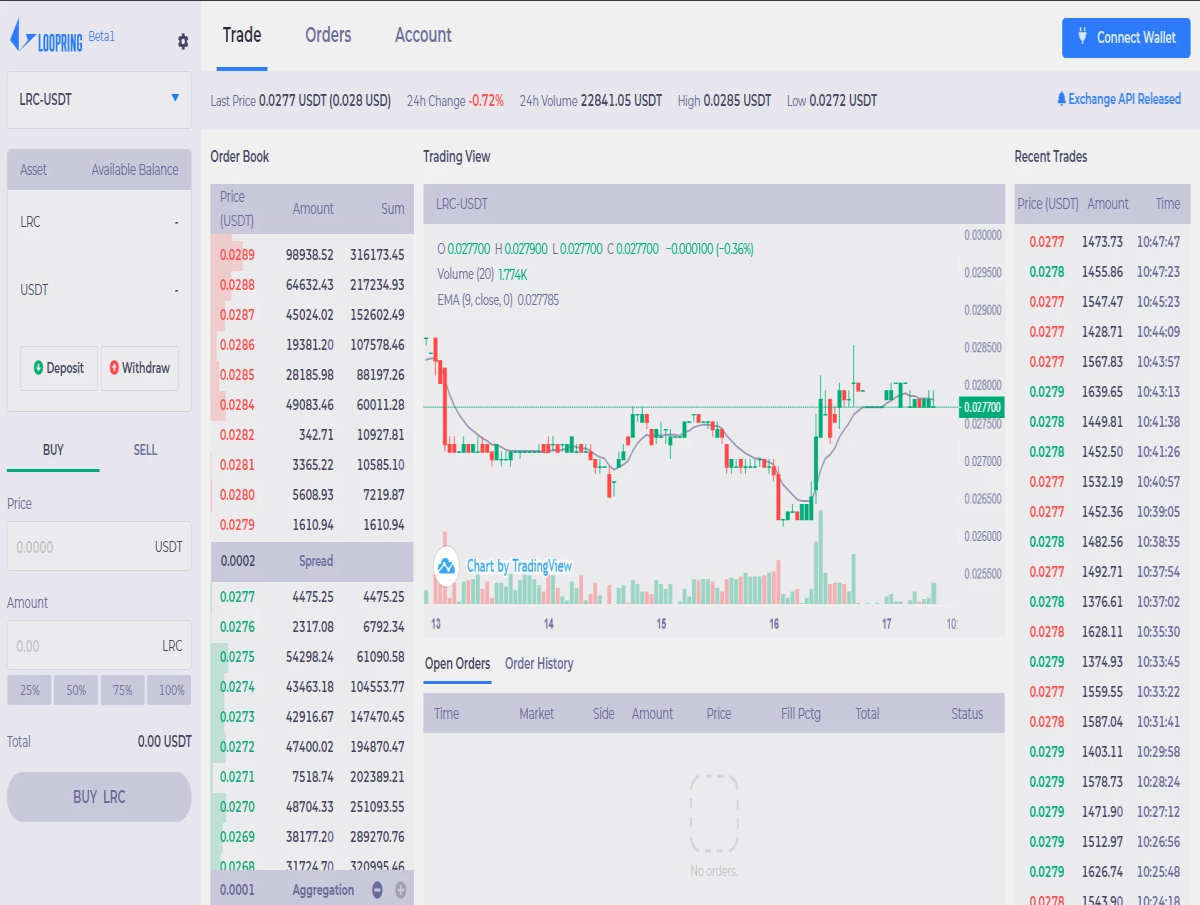
The team recently released their own DEX called Loopring.io and it is built on top of their new Loopring 3.0 which includes zKRollups. This means that the Loopring protocol can handle trades of up to ~2000 TPS whilst maintaining the security of the underlying blockchain (Ethereum).
Loopring.io itself can currently handle around 200 trades per second which will be improved once Ethereum itself upgrades to the ETH 2.0 protocol.
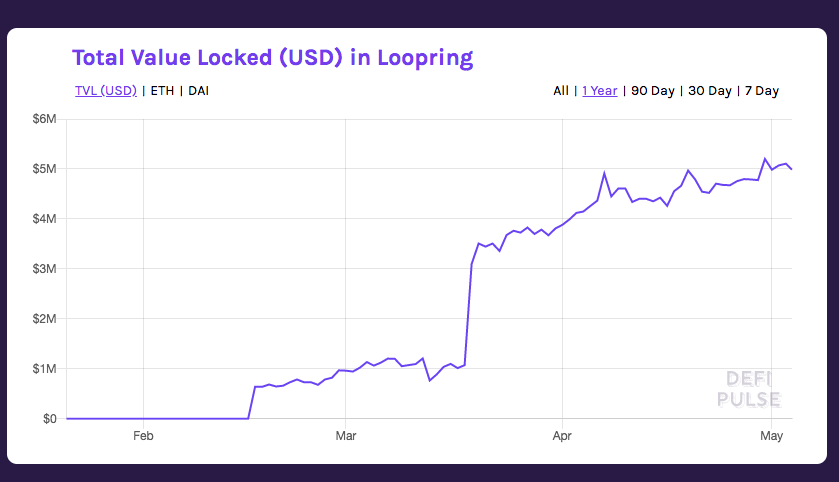
Taking a look at the stats from DeFi Pulse below, we can see that an increasing number of Loopring is being constantly locked up in the Loopring smart contracts. Just from the end of February, we can see that they have managed to reach the $5 million thresholds in a very short period of time.
Aave
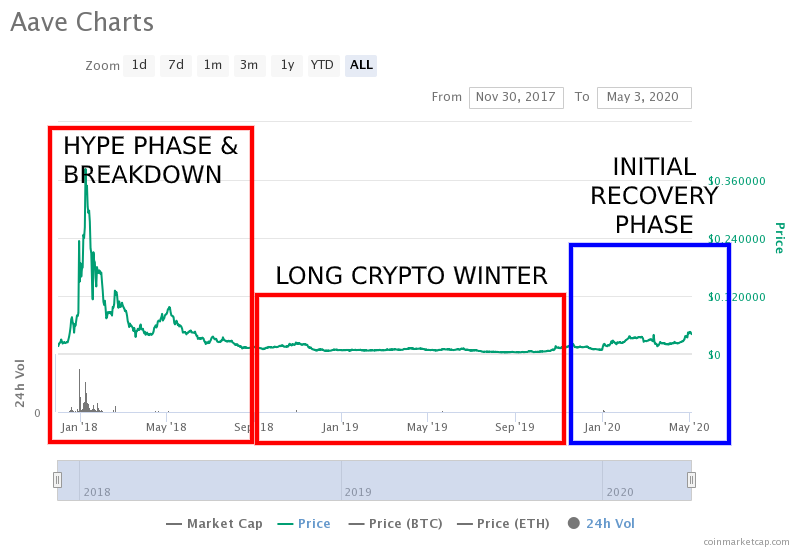
AAVE - CHART FROM JANUARY 2018 TO MAY 2020
Looking at Aave (LEND) we can see that this cryptocurrency managed to increase as high as $0.41 during the Hype Phase that we saw in January 2018. It quickly plummeted and was hitting the $0.013 by the time August 2018 came around as the coin entered the Cryptocurrency Winter.
During the Crypto Winter, LEND went on to trade between the $0.01 and $0.004 levels for a period of over 18 months.
It started to come out of this Crypto Winter toward the tail end of December 2019 but really started to gather some strong momentum in January 2020. Let us take a closer look at the recovery phase.

AAVE - RECOVERY PHASE - JAN 2020 TO May 2020
Looking closer at the Recovery Phase, we can see that LEND started to gain some solid traction in January as the volume began to pick up. The cryptocurrency cleared the $0.024 level by the end of January and went as high as $0.04 during February 2020.
The March market collapse did cause LEND to drop a little, however, it quickly recovered and toward the tail end of April 2020, we can see that the coin made a fresh 2020 price high at the $0.046 level, completely recovering all of the losses incurred during the Coronavirus pandemic panic!
So, what is going on with Aave?
Aave is an open-source and non-custodial protocol to earn interest on deposits made in cryptocurrency. You can also borrow cryptocurrency from the platform at the same time.
The Aave Twitter following has been exploding in 2020 - and rightly so! In the short 4-months, the project has managed to increase its following by up to 4000 users.

This is because Aave has been making some major updates to its platform. From an entirely new protocol homepage design to a fresh Token Burn Page, the ecosystem behind Aave continues to thrive. This new Token Burn page allows users to see how much LEND has been burned as all fees for borrowing and executing Flash Loans are redirected to burn LEND and decrease the token supply.
The team also released a comprehensive Risk Framework after the black swan event that happened in March that was caused by the Coronavirus pandemic.
On top of all of this, Aave has translated its website and dApp into Spanish, Italian, French, and Chinese - providing a new demographic to tap into.
And all of this has evidently been working very well when we look at how much USD value is locked into Aave.

Aave is actually not the 5th highest ranked DeFi dApp as the project now has a total of around $42 million locked away inside of their protocol. This shows that LEND is gaining solid traction amongst the community as investors continue to pour their assets into this DeFi solution to gain interest on their holdings.


