
This is part 7 in my journey to properly learn Technical Analysis writing down what I've learned in bite-sized pieces making sure everything is easy to grasp. It is recommended to be up to date with the previous parts as this builds upon those. They can all be found here.
#7 Moving Averages
This is another Technical Indicator that should be used as a way to confirm setups after looking at price and trends first similar to Volume which was covered last time.
What are Moving Averages?
They are basically the average price based on a number of weeks/days/hours which helps to smooth out the short term ups and downs. These Moving Average lines on the chart tend to form support & resistance zones and help to identify those along with trend change. There are 2 types
-
Simple Moving Averages (MA): These just take the average price of a number of weeks/days/hours calculated in a way where all the individual price points have the same weight.
-
Exponential Moving Averages (EMA): These averages give more weight to the most recent price points and make them more responsive to news. Since crypto prices move rather quickly, these exponential moving averages are what you want to use!
Straight Trend Line vs Moving Average Trend Line
Moving Averages can be seen as trend lines (See #2 Trends) which are not straight but are in a way more detailed and also often act as support or resistance.
Example (10 EMA on 1-Hour Ethereum Chart)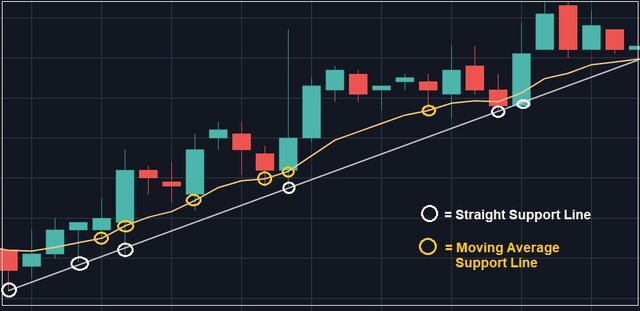
Adding Exponential Moving Average on Tradingview
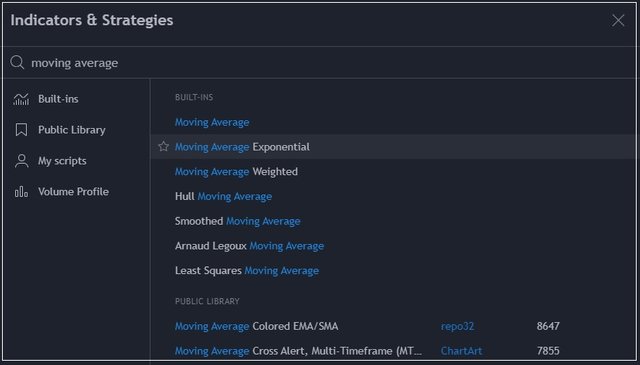
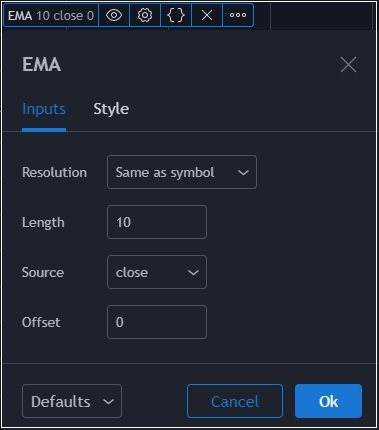
You are allowed to add 3 indicators on the free version of Tradingview. If you want to add the Exponential moving averages, just go to indicators and search for "Moving Average" and select the Moving Average Exponential. You will see that the line has been added to all charts along with a small box under the name of the coin which chart you are watching where you can change the length and the style to suit your needs. If you choose 10 for Lenght, it will show the 10 Hour EMA if you look at the 1-hour chart, the 10 Day EMP is you look at the 1-day chart, and so on...
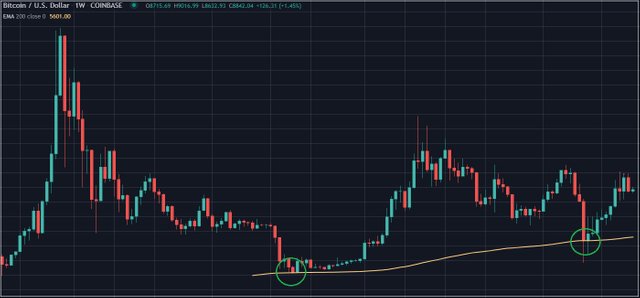
200-Week Moving Average
The 200-Week Moving average has been a strong long-term support line for Bitcoin as it bottomed exactly there on the Coinbase BTC-USD weekly closing prices twice. As long as bitcoin stays above this line, it can be seen as being in a long term bull market. In case there is another big crash, this is pretty much the line you want to keep an eye on.
10 & 30 Moving Averages
Having two moving averages on your chart with a different timing can be useful to identify up or downtrends along with support & resistance lines. The general rule is:
-
If the shorter-term moving average is above the longer-term moving average, it can be seen as an uptrend with the moving average acting as a support line.
-
If the longer-term moving average is above the shorter-term moving average, it can be seen as a downtrend with the moving average acting as resistance.
An example of Moving Averages on the ETH/BTC Daily Chart.
Blue Line = 10-Day EMA
Purple Libe = 30-Day EMA
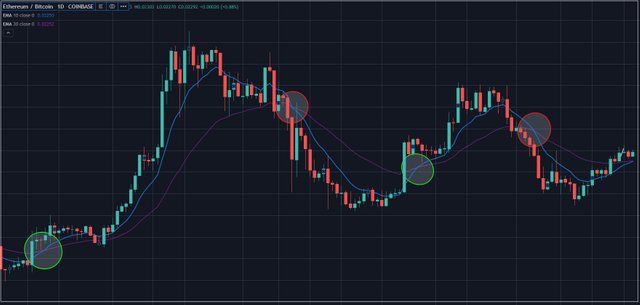
Whenever there is a crossover between the 10 and 30 EMA, it clearly indicates a trend change with the moving averages often acting as support or resistance zones.
There are no exact rules for moving averages and everyone has their own style. The most looked at are the 10,20,30 & 50 Moving Averages.
Previous Technical Analysis Lessons
Technical Analysis #1 | Basics
Technical Analysis #2 | Trends
Technical Analysis #3 | Bearish Patterns
Technical Analysis #4 | Bullish Patterns
Technical Analysis #5 | Symmetrical triangles
Technical Analysis #6 | Volume Indicator
Future posts in this series can be found here
https://www.publish0x.com/costanza-technical-analysis
Free Software I use for Charts
Tradingview
Platform I use for Trading
Binance
Hive: https://hive.blog/@costanza
Steemit: https://steemit.com/@costanza
Scorum: https://scorum.com/en-us/profile/@costanza
Twitter: https://twitter.com/costanzabets


![[The Macro Washout]: Why Bitcoin’s Critical Support Levels Are Trapping Impatient Retail Day Traders](https://www.publish0x.com/img/1182453.png?action=resize&ar=1&h=191&inv=0&ori=1&st=1&up=1&w=340&signature=ee20df488b6ad9dfd63729d4d86d02f45f17ceb8bc54a06a849bbfafff16785e)

