
I continue to properly learn Technical Analysis in around 30 days instead of only watching Youtube TA videos for entertainment. This series of posts contains what I've learned during this time as a way to motivate myself to keep going and possibly help others that are going through the same process.
Last time I covered some of the main Bearish Patterns in the last post. Many of those patterns in reverse are bullish indications. The same rule applies that it's all about probabilities and there is no certainty of the price going up whatsoever when these patterns form.
#4 Bullish Chart Patterns
1 Cup & Handle
2 Inverted Head & Shoulders
3 Double Bottom
4 Ascending Triangle
1 Cup & Handle
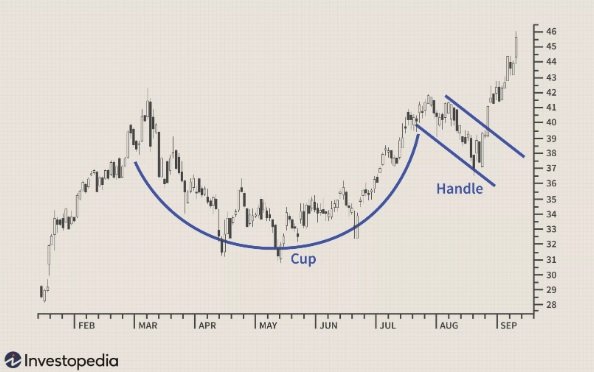
The cup & handle is a base formation where there was a high following a long slow bottoming pattern followed by a new top at a similar height to the first top. At that point, there is another pullback with a lower volume followed by the next leg up. The drop after the first peak can not be a steep move down and shouldn't go all the way down again. the drop back after the 2nd peak also can't go down to the cup low and should have low volume. The psychology behind this pattern is that the ones who bought at the 1st top are back even and sell their holdings which forms the handle. Once they are out the price is ready to move up again.
Example: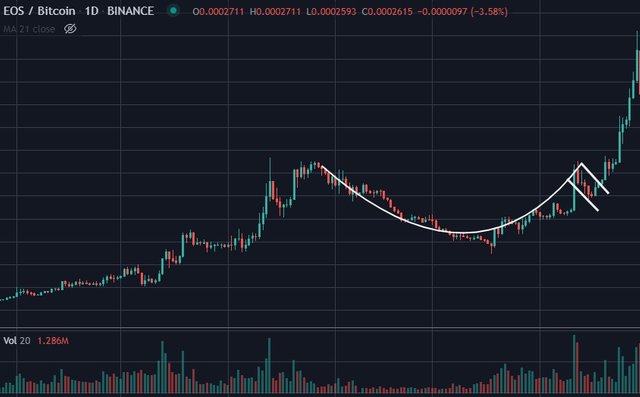
2 Inverted Head & Shoulders
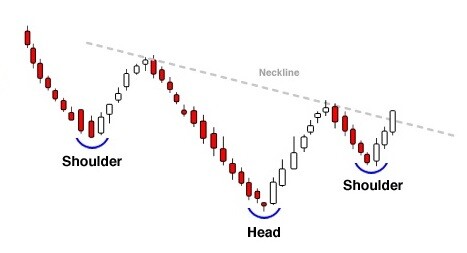
This is basically the exact opposite of the regular Head & Shoulders patters as laid out in the Bearish Patterns Post. It is one of the stronger bullish indications when this pattern forms on a longer-term timeframe. Once it breaks the neckline it's usually followed by a sharp move.
Example: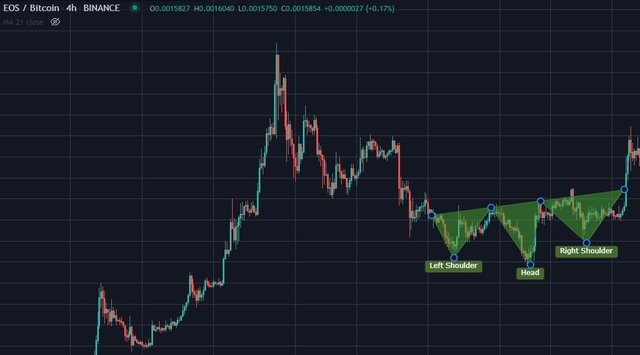
3 Double Bottom
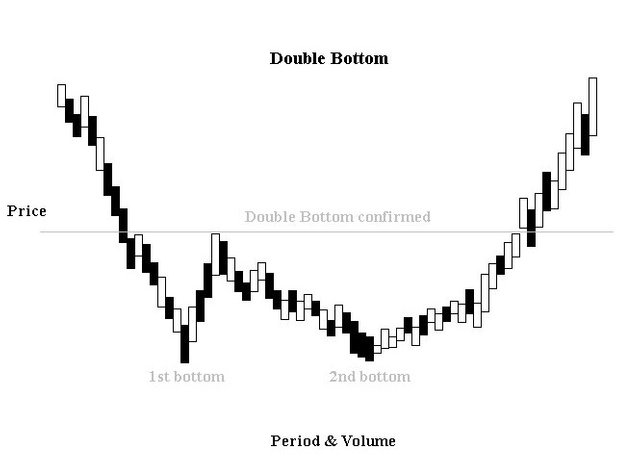
This pattern is also the exact same as the double top but the other way around and indicates a good bottom on the longer-term timescale.
Example (can also be seen as inverted H&S) :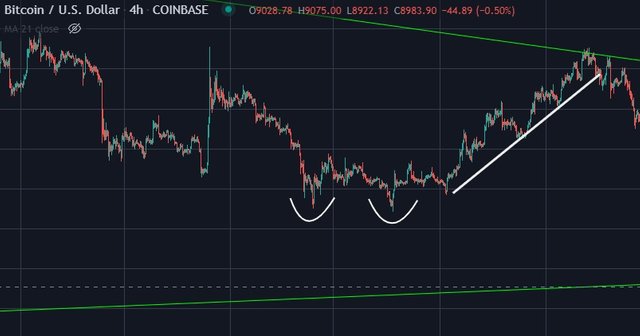
4 Ascending Triangle
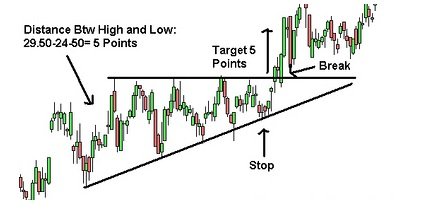
Also this one is the exact opposite of the bearings descending triangle and works well on smaller time scales. It just recently formed on the BTC Chart followed by a nice price increase after the resistance line was broken after having multiple touches with the upward sloping support line.
Example: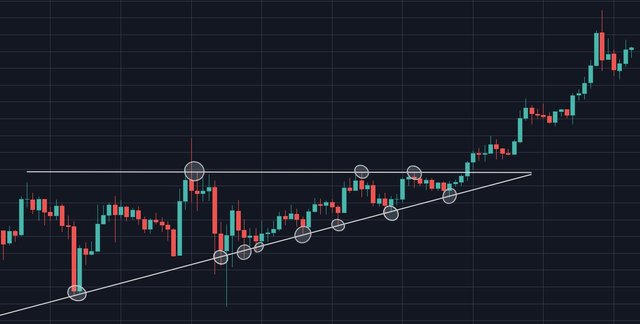
Previous Technical Analysis Lessons
Technical Analysis #1 | Basics
Technical Analysis #2 | Trends
Technical Analysis #3 | Bearish Patterns
Technical Analysis #3 | Bullish Patterns
Free Software I use for Charts
Tradingview
Hive: https://hive.blog/@costanza
Steemit: https://steemit.com/@costanza
Scorum: https://scorum.com/en-us/profile/@costanza
Twitter: https://twitter.com/costanzabets


