
I continue my journey to properly learn all the basics of Technical Analysis making a summary of what I've learned in bite-sized pieces as a way to do better and possibly help those who are also getting into it more.
In the past 2 posts, I covered some of the most common Bullish & Bearish Patterns. This time I'm taking a closer look at a more neutral pattern which is the Symmetrical Triangle.
#5 Symmetrical Triangles
This can be seen as a neutral pattern and the psychology is very similar to that of ascending and descending triangles with the difference that buyers and sellers seem to be in balance and both decrease over time causing a breakout to the up or downside near the end.
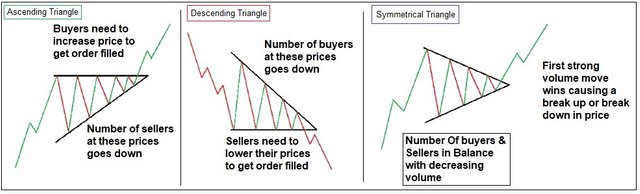
When the range is narrowing down, there is a saying that "Next Move Wins". You do want to see a strong higher volume as often there will be a lower volume move outside of the triangle to quickly break the other way after. Once there is a strong move, this is typically the direction it will keep going afterward.
Example: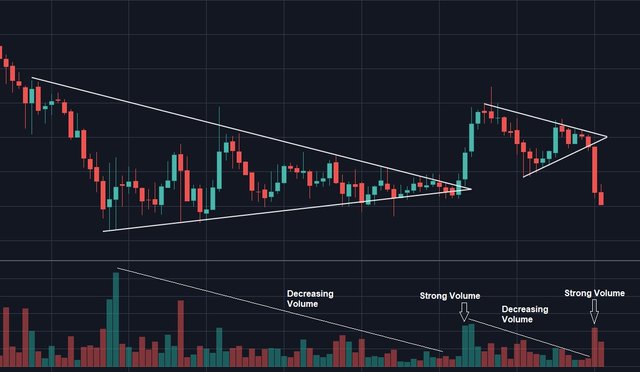
The Chainlink-BTC chart of the past couple of days shows 2 clear symmetrical triangle patterns. Both had clear support and resistance lines with decreasing volume followed by a strong move at the end of the triangle with increased volume.
Example: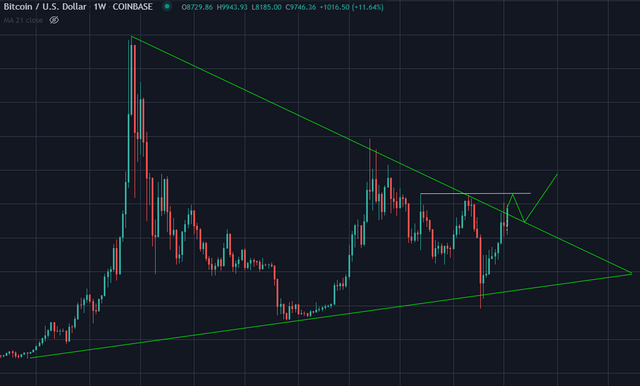
The Bitcoin chart is also forming a very long-term symmetrical triangle on the weekly chart and is currently trying to break out of it. What often happens when it breaks out is that it retests the resistance making it act as a new support line. 10500$ is the line many people are looking at as it as breaking that would mean Bitcoin sets a higher high. Symmetrical triangles on a longer time frame usually break up or down before reaching the points where both lines meet.
Falling & Rising Wedges
2 more triangle pattern that can be used for trading are the Falling and Rising Wedge. They are somewhat symmetrical triangles that point up or down in the chart. A Falling wedge points down and tends to break out to the upside while a Rising wedge points up and tends to break to the downside. As always, these are no absolutes and merely probabilities. Similar to all patterns, the longer the timeframe, the more decisive and strong the move will be.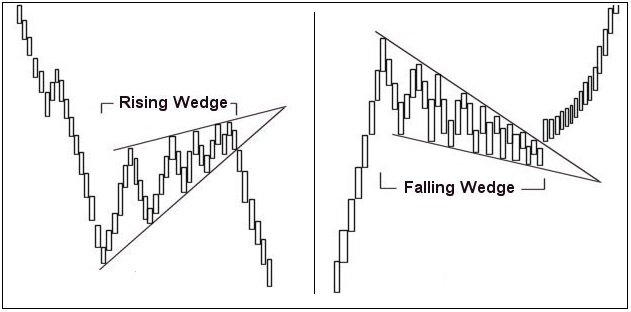
Previous Technical Analysis Lessons
Technical Analysis #1 | Basics
Technical Analysis #2 | Trends
Technical Analysis #3 | Bearish Patterns
Technical Analysis #4 | Bullish Patterns
Future posts in this series can be found here
https://www.publish0x.com/costanza-technical-analysis
Free Software I use for Charts
Tradingview
Hive: https://hive.blog/@costanza
Steemit: https://steemit.com/@costanza
Scorum: https://scorum.com/en-us/profile/@costanza
Twitter: https://twitter.com/costanzabets


