Good morning
It's been awhile since we've been in touch. I have been struggling with the XRP count. While the ES_F counted very nicely lately and printed a lot of upside, the XRP count has me confused, we are still in the range of 37 cents after calling a local bottom in June with a lot of overlapping waves. It is not that I lost my interest in XRP, simply could not come up with an idea for the sideways mess.
But after a lot of study I found something that I can share with you :
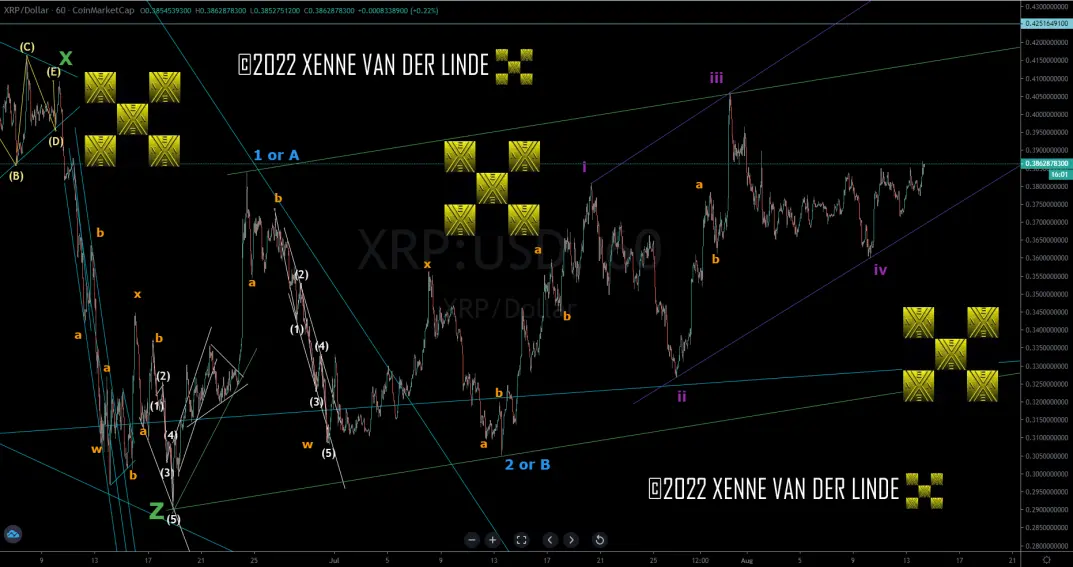
From the recent low in mid June we have a move that can work as five waves up, it was followed by a three wave down move. That is pretty obvious.
But then the confusion starts as we only printed zigzags up & down, so maybe a leading diagonal to start wave 3 or an ending diagonal to end wave C. The diagonal certainly looks strange, but it breaks no rules and is slightly expanding. The only thing that bothers me a bit is that wave iv is shorter then wave ii, so maybe iv is unfinished and will go a bit lower? It would certainly create a more expanding look to the diagonal, however the trendlines are already expanding as of now, every so slightly. Anyways, I have seen stranger structures, the thing is the market wants to hide it's move as best as possible, and by creating such a weird pattern it creates a lot of confusion. We have to monitor if we get that fifth wave, a fifth wave would complete the diagonal.
However with diagonals you never know if they are leading or ending... And in this case the diagonal might work better as an ending diagonal in the C wave position. In that case the diagonal would end an X on a higher degree. The stock market is pretty extended and even if it does a healthy pull back it might create some panic in the crypto markets. Problem with the leading diagonal idea, it would be a lower degree subwave of iii, but it is already bigger then wave 1, so that causes degree issues. There remains the option that the downmove truncated mid July and that the upward move starts from there, with a leading diagonal.
Let me end with a reminder of the big picture :
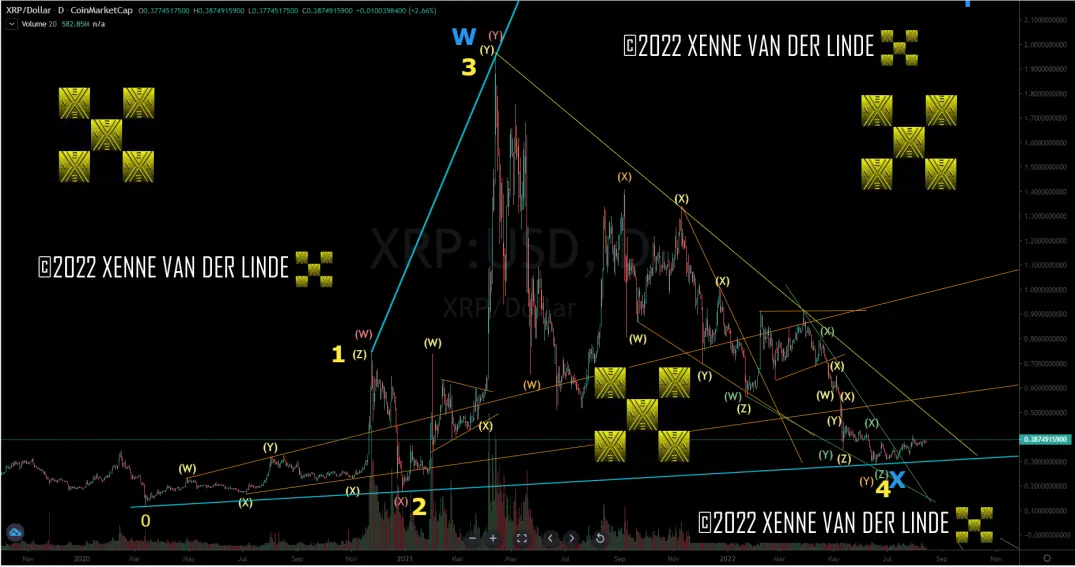
It remains to be seen if the current strength is another X of higher degree or if we have a real bottom in place. A break over that yellow trendline could set XRP free. IF we fail at the line we could go back down and create a lower low, the low can also truncate a bit.
Hopefully the XRP count becomes a bit more clear in the near future, it's good to have at least an idea....
Good luck & take care!
Yrs truly,







