Hello again
Day 777 did not bring us Joy, if you start counting from the start of the lawsuit that is. If you start counting 777 days from the price low in December 2020 (the 29th) it points to February 14th. Another potential important day for XRP and some hopium to start this post.
But our focus should be on the count. After my post on Sunday XRP started impulsing down, this was expected - the impulse completed on the 7th, this was leg (a) of the next zigzag and it was followed by a bounce for (b) - take notice , it is not entirely sure (b) is complete. But if (b) completed we probably have seen i of (c) at this point :
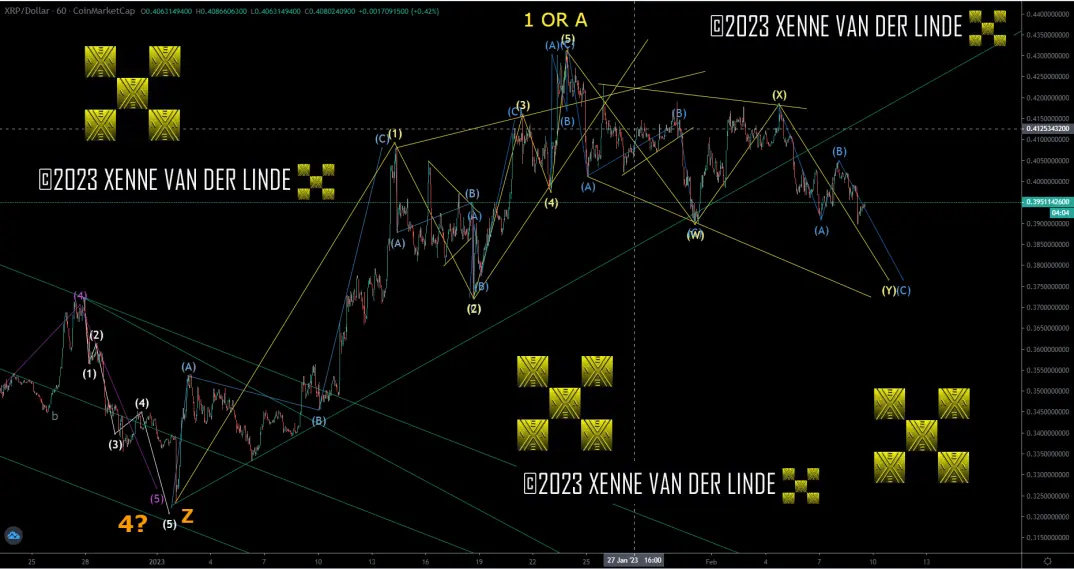
For clarity I only show you one option in the chart above, there are certainly other options like I said in my previous update. But if this count is correct I would expect some more downsideto complete Y. You may notice that I slightly updated the count, in previous count I was counting a triple zigzag, that has now become a double with a triangle for (b) of w, this count works better, imho.
Still looking for the levels I pointed out in my previous post, a 50% retrace at 0,377. Also W=Y at 0,377, certainly a level of interest. Take notice this are levels on my exchange neutral chart and I would not be surprised to see stoploss hunting and lower prices on most exchanges. So I will certainly put in some buy orders at lower levels and if I am lucky they will get filled. Take also notice that it remains possible that the double zigzag becomes a triple, this would require some more patience.
Let me end with the big picture :
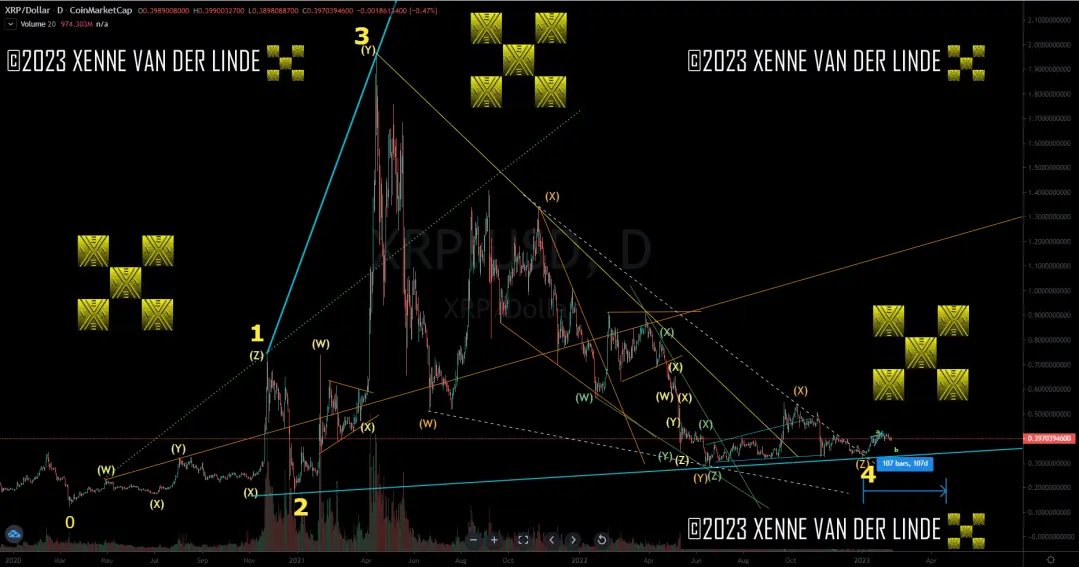
That diagonal is so tiny, but if it really is a diagonal it does not matter. But if you wanna count an impulse from the low (I assume that is what most wave counters doing) the upside would be extremely limited because of degree issues in the next impulse.
That is all for now!
Good luck!
Lots of Love,







