
Since the beginning of June, the Bitcoin dominance index has been trading very close to the line of upward support. For all this time, the market has not been able to bounce off of it. This is fraught with the fact that, in the end, the index will make a bearish breakdown of this line instead of a rebound.

Line of upward support
The Bitcoin Dominance Index (BTCD) has been moving along the upward support line since February 13. At the time of writing, it was traded directly in the area of this line, and a similar situation has been supported since the beginning of June.
Although at first the index broke the line of a shorter downward resistance, which potentially promised him the launch of a new uptrend, then the market turned around, bouncing off the 50- and 200-day moving averages (MA), which subsequently formed a bearish intersection.
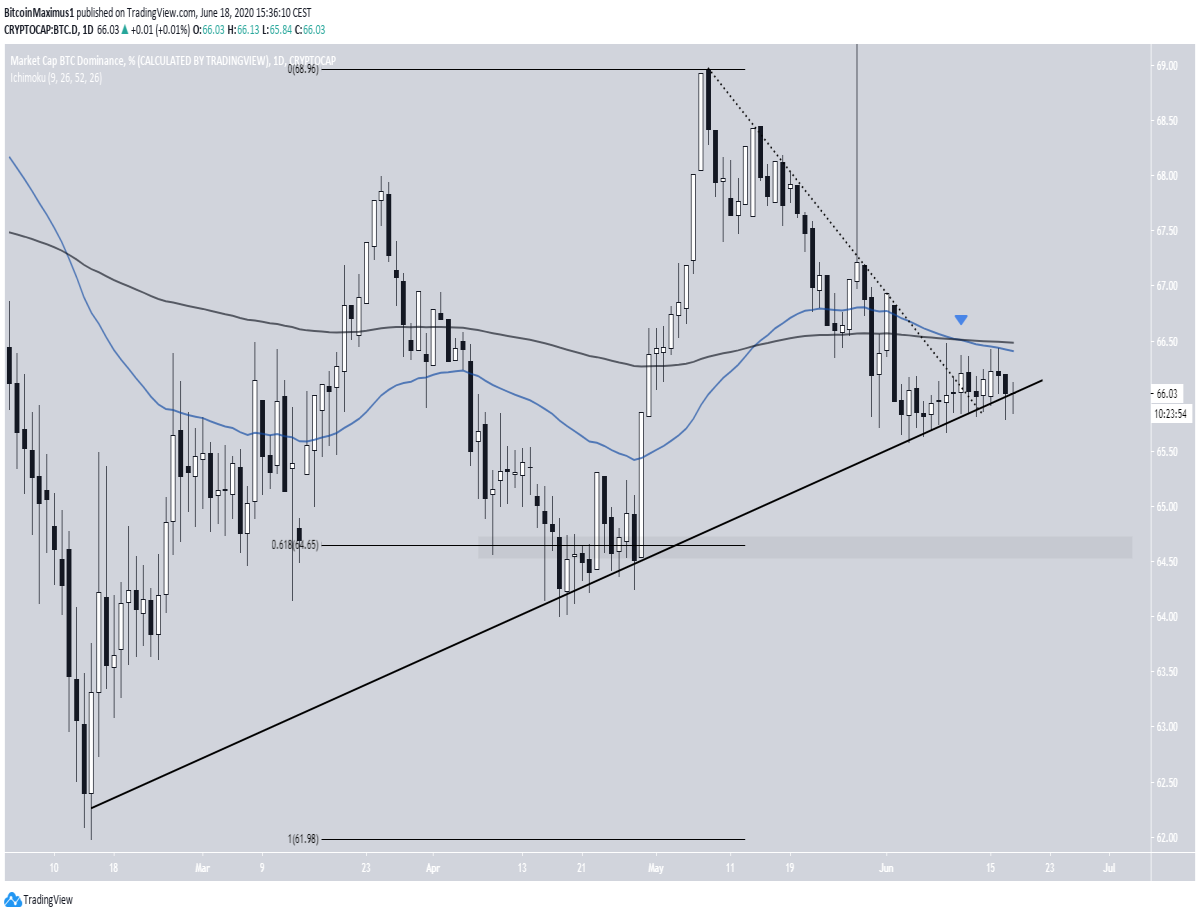
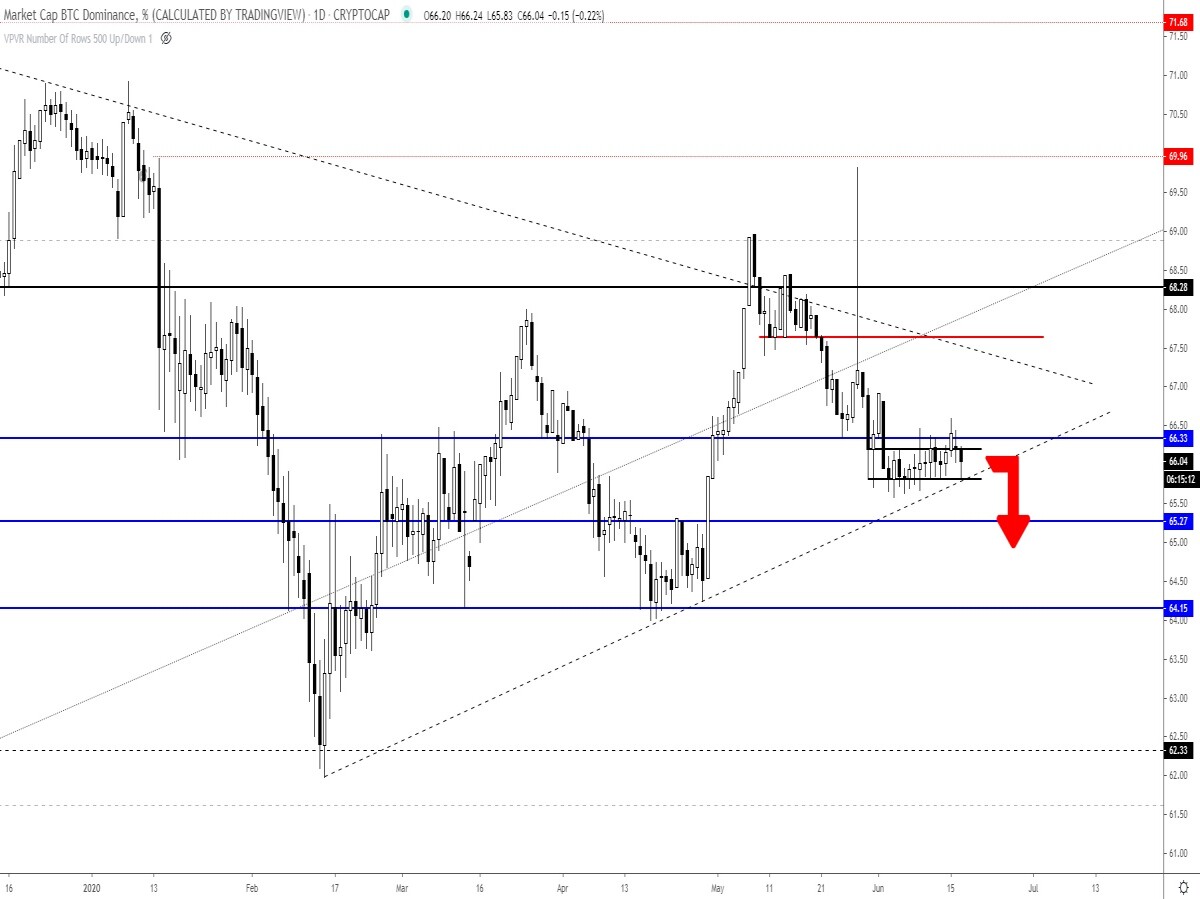
A bearish breakdown of the aforementioned support line can send BTCD to 64.6%, where the Fibo level 0.618 of the correction of the entire bullish move passes. Popular crypto trader @Theeurosniper shared a BTCD chart with his readers on Twitter showing the same line of upward support. However, he noted that a bearish breakdown of the short-term range could lead to a longer decline:
“It would be just great if we could break through the lower limit of this small range,” he wrote.
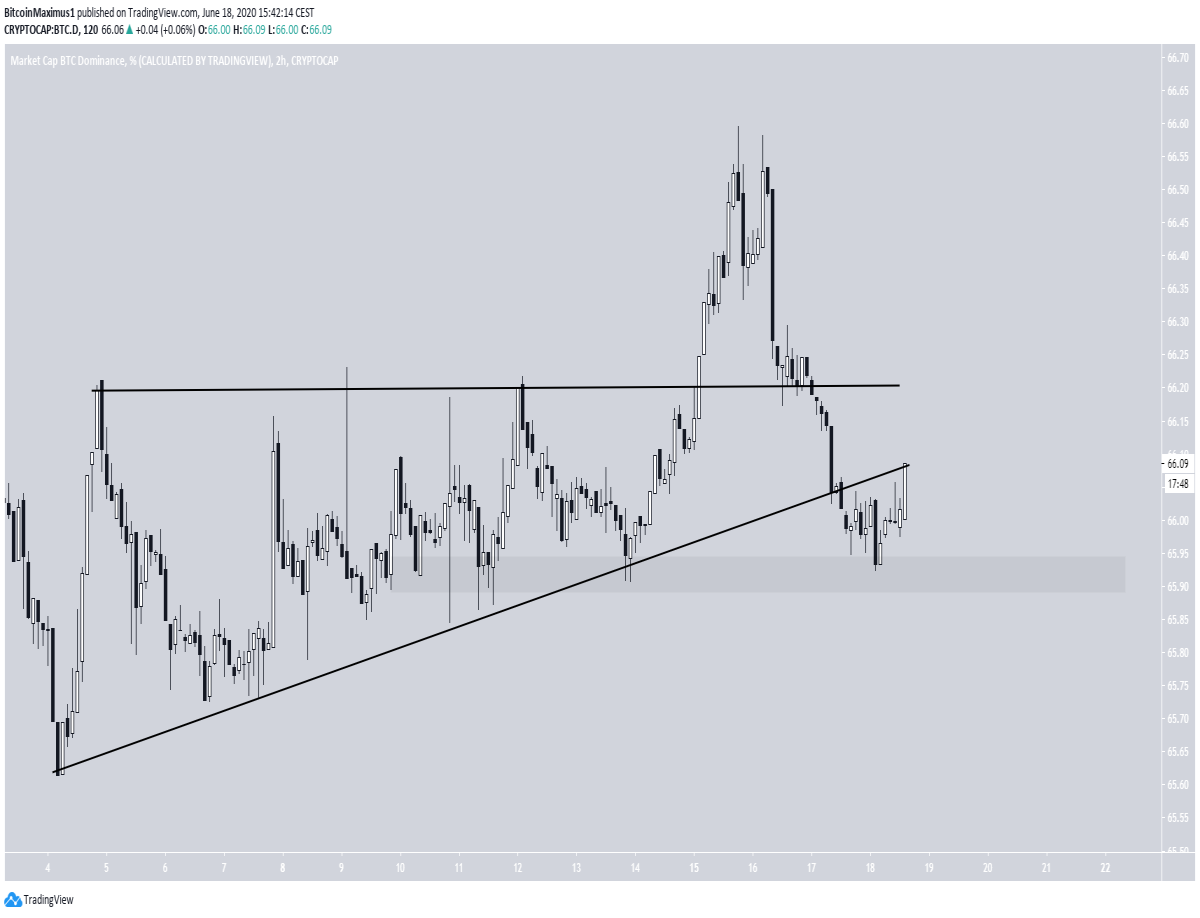
Short term chart
On the hourly chart, it is not possible to highlight a clear trading range, but I see little support here in the area of 65.9%. Her bearish breakdown may accelerate the pace of decline.In addition, since June 4, the BTCD index has been trading inside the rising triangle. At first, the market made a bullish breakthrough of this pattern, but could not gain a foothold at the achieved levels and as a result sank below the support line of this triangle. This is a bearish signal and suggests that BTCD may continue to decline - which is consistent with the results of my analysis of the daily chart.
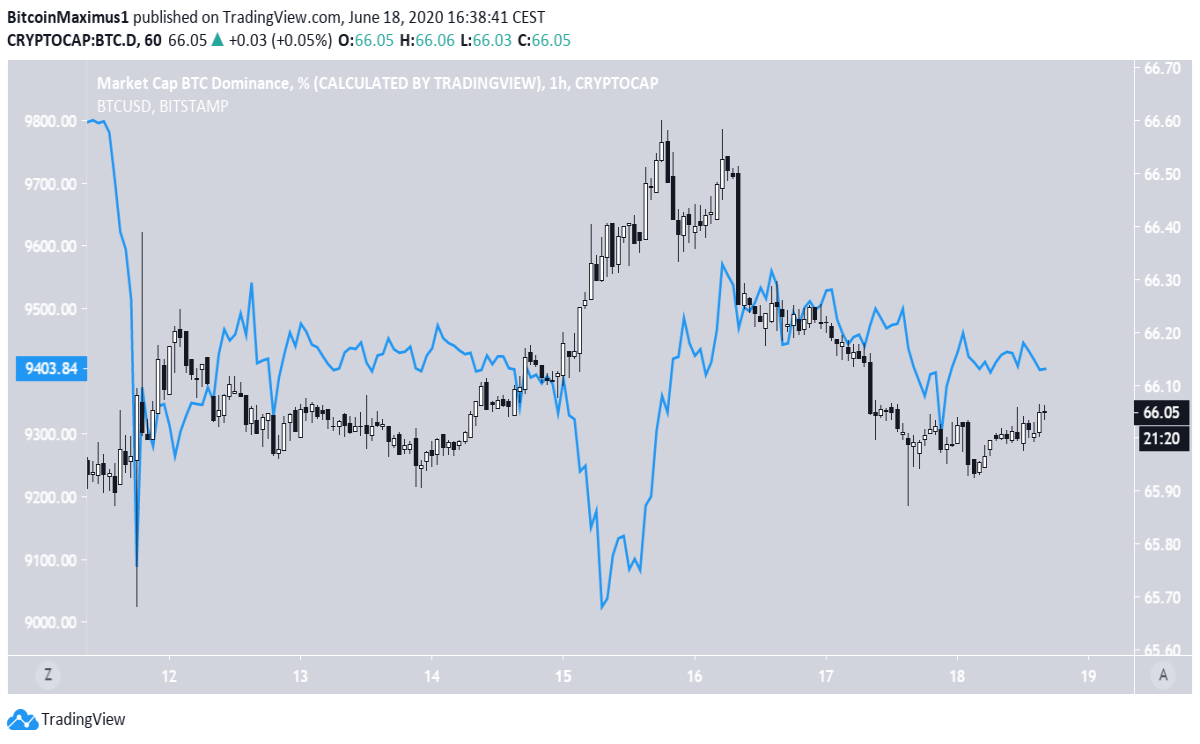
Bitcoin Correlation
The graph below shows the BTCD index (candles) and the Bitcoin exchange rate (blue line). In June, a direct correlation of these two indicators was disrupted. However, now - at least in the short term - I can not confidently reveal an unambiguous correlation between the rate of BTC and BTCD. Although at first the drop in bitcoin provoked significant jumps in BTCD, the dominance index has been decreasing since June 16, despite the direction of movement of bitcoin.
Thus, the Bitcoin dominance index shows signs of weakening, since it can not in any way bounce off the line of long-term support. A bearish breakdown of this line is potentially capable of causing an accelerated decline in BTCD.


