
Helloooo out there in the world of Ethereum and crypto!
My name is Trevor bring to us today the updated Historical Data Chart for Ethereum!
Riiiight here 👇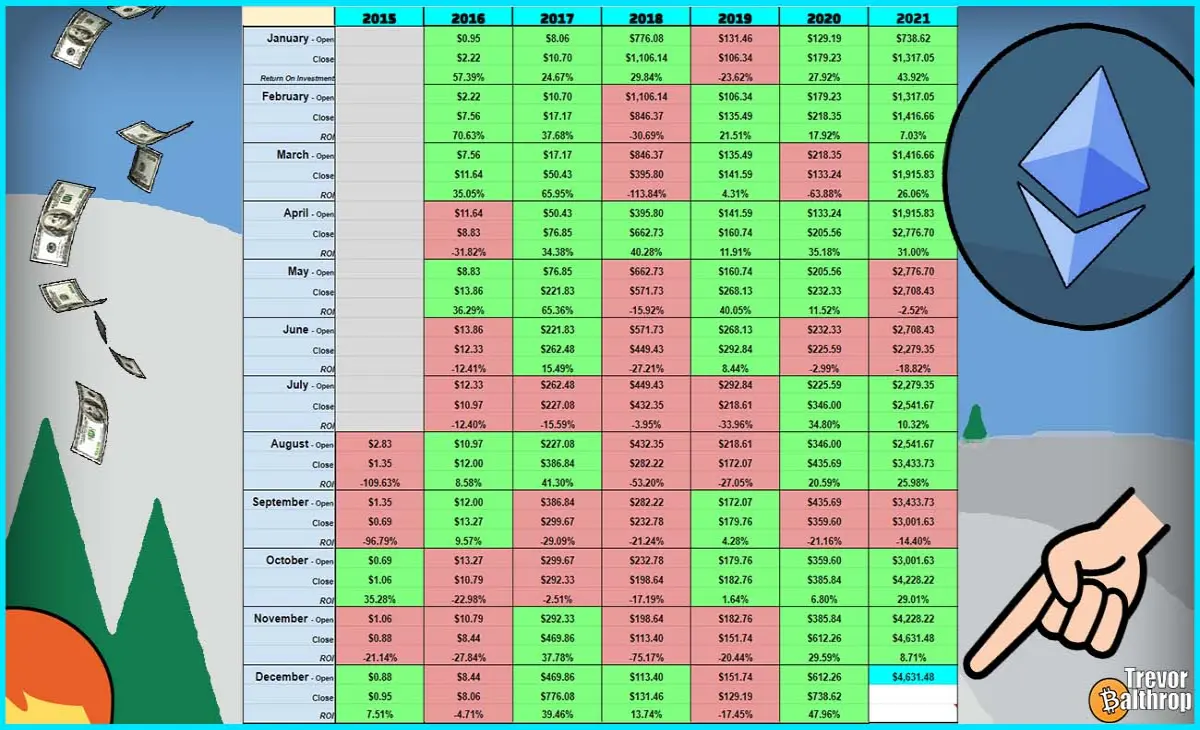
Now if this is your first time viewing this chart there should be no need to worry!
Just check out the video in my previous article or a quick glance at the transcript below
👇
https://www.publish0x.com/trevor-balthrop/bitcoins-historical-monthly-chart-explained-xpplynr
Now let's get into it what we are seeing for Ethereum now.
Ethereum closed November officially opening December at a price value of $4,631.48 USD per Ethereum.
Last month we started out with a price of $4,228.22 per Ethereum.
Since Ethereum's price ended up being higher than the previous open/close we can officially say this month ended positive.
Anyone who may have purchased Ethereum on the 1st of last month would be in profit going into the 1st of this new month of December here.
Compared to Bitcoin which had a Red month, Ethereum ended positively in the Green.
This supports the sentiment in the markets that Ethereum is continuing to chip away at the Bitcoin Dominance on track to outperform it. 
We may see a lot of volatility in the early few weeks of December as Bulls try to push the price up past the previous All-Time High.
If we look at our chart here compared to years in the past, we could see 20% to 50% increase in Ethereum's price going into the 1st of the New Year.
That would shape up well with how a "blow-off top" would look like on a chart like such as this one.
Obviously on a chart like this it is harder to see when those kinds of tops occurred since it only measures the price value on the first of the month.
Since this chart does not take into account any lows or highs that occurred during that month.
The only thing we have to go off of is percentages and previous years performances.
Luckily for you though, we still have all the other charts we normally look at.
Combine your knowledge on traditional charts with the insight this chart gives us and it becomes a lot easier to see when these type of moves will happen.
Remember, the trend is your friend!
Also, as I must say, in no way is this professional financial advice so I highly recommend doing your own research here when it comes to investing.
In my own opinion though, based on what I am seeing here, this Bull Run is about to get insane if we hodl on for just a little bit longer here.
Good luck out there everyone, please be safe and play smart!
Thanks so much for stopping by and I hope you have a BEAUTIFUL day in crypto!
This is Trevor's signature 🦰
and article!
Check out the website
at
www.TrevorBalthrop.com






