
A look at the Monthly charts of Gold and Bitcoin.
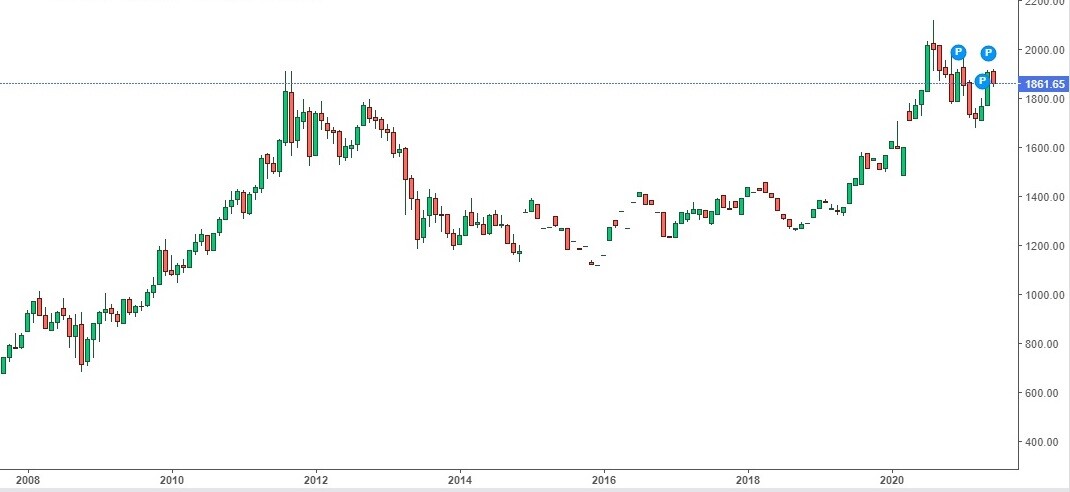
Gold price had broken its previous all term high of in 2020, reaching close to $2100 in August.
Then it fell 19% over a period of six months, made a convincing bounce from around $1700, gaining more than 10% since then till date.
The chart shows a clear bull flag made, and then a breakout.
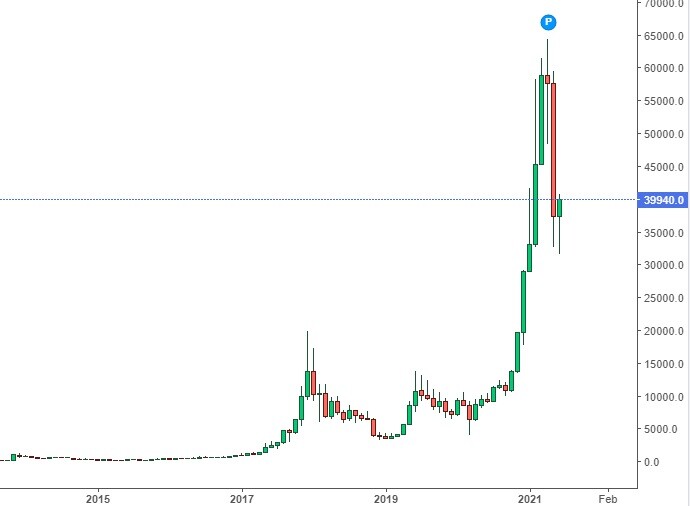
Bitcoin also made new all time highs in 2020, and then peaking to prices around $64500, April this year. After more than a 50% drop from its peak,
Bitcoin price is hanging in balance, with the $41K proving a major resistance in multiple attempts.
In the short term, Gold is looking ready to break the 2020 Highs. The Gold Bullrun could melt faces and send inflationary signals to the markets.
BTC will have several resistances in the way to $64K.
If the $41K resistance is not cleared and the price shows further weakness, we could be testing lower ranges, upto the strong $30K support zone.
Strong price action is likely in either direction in the coming months, perhaps after more consolidation.
From a technical perspective, Gold looks a safer bet for gains in the short run. A time to accumulate and Hodl BTC.
NB: The above is not financial advice. Only shared for informational purpose.


