
Global market participants are keeping a close eye on the US stock market right now, especially the S&P 500 index. While stock prices remain near elevated levels, a sudden wave of warning signals regarding surging short positions and bearish sentiment has started to flood the market.
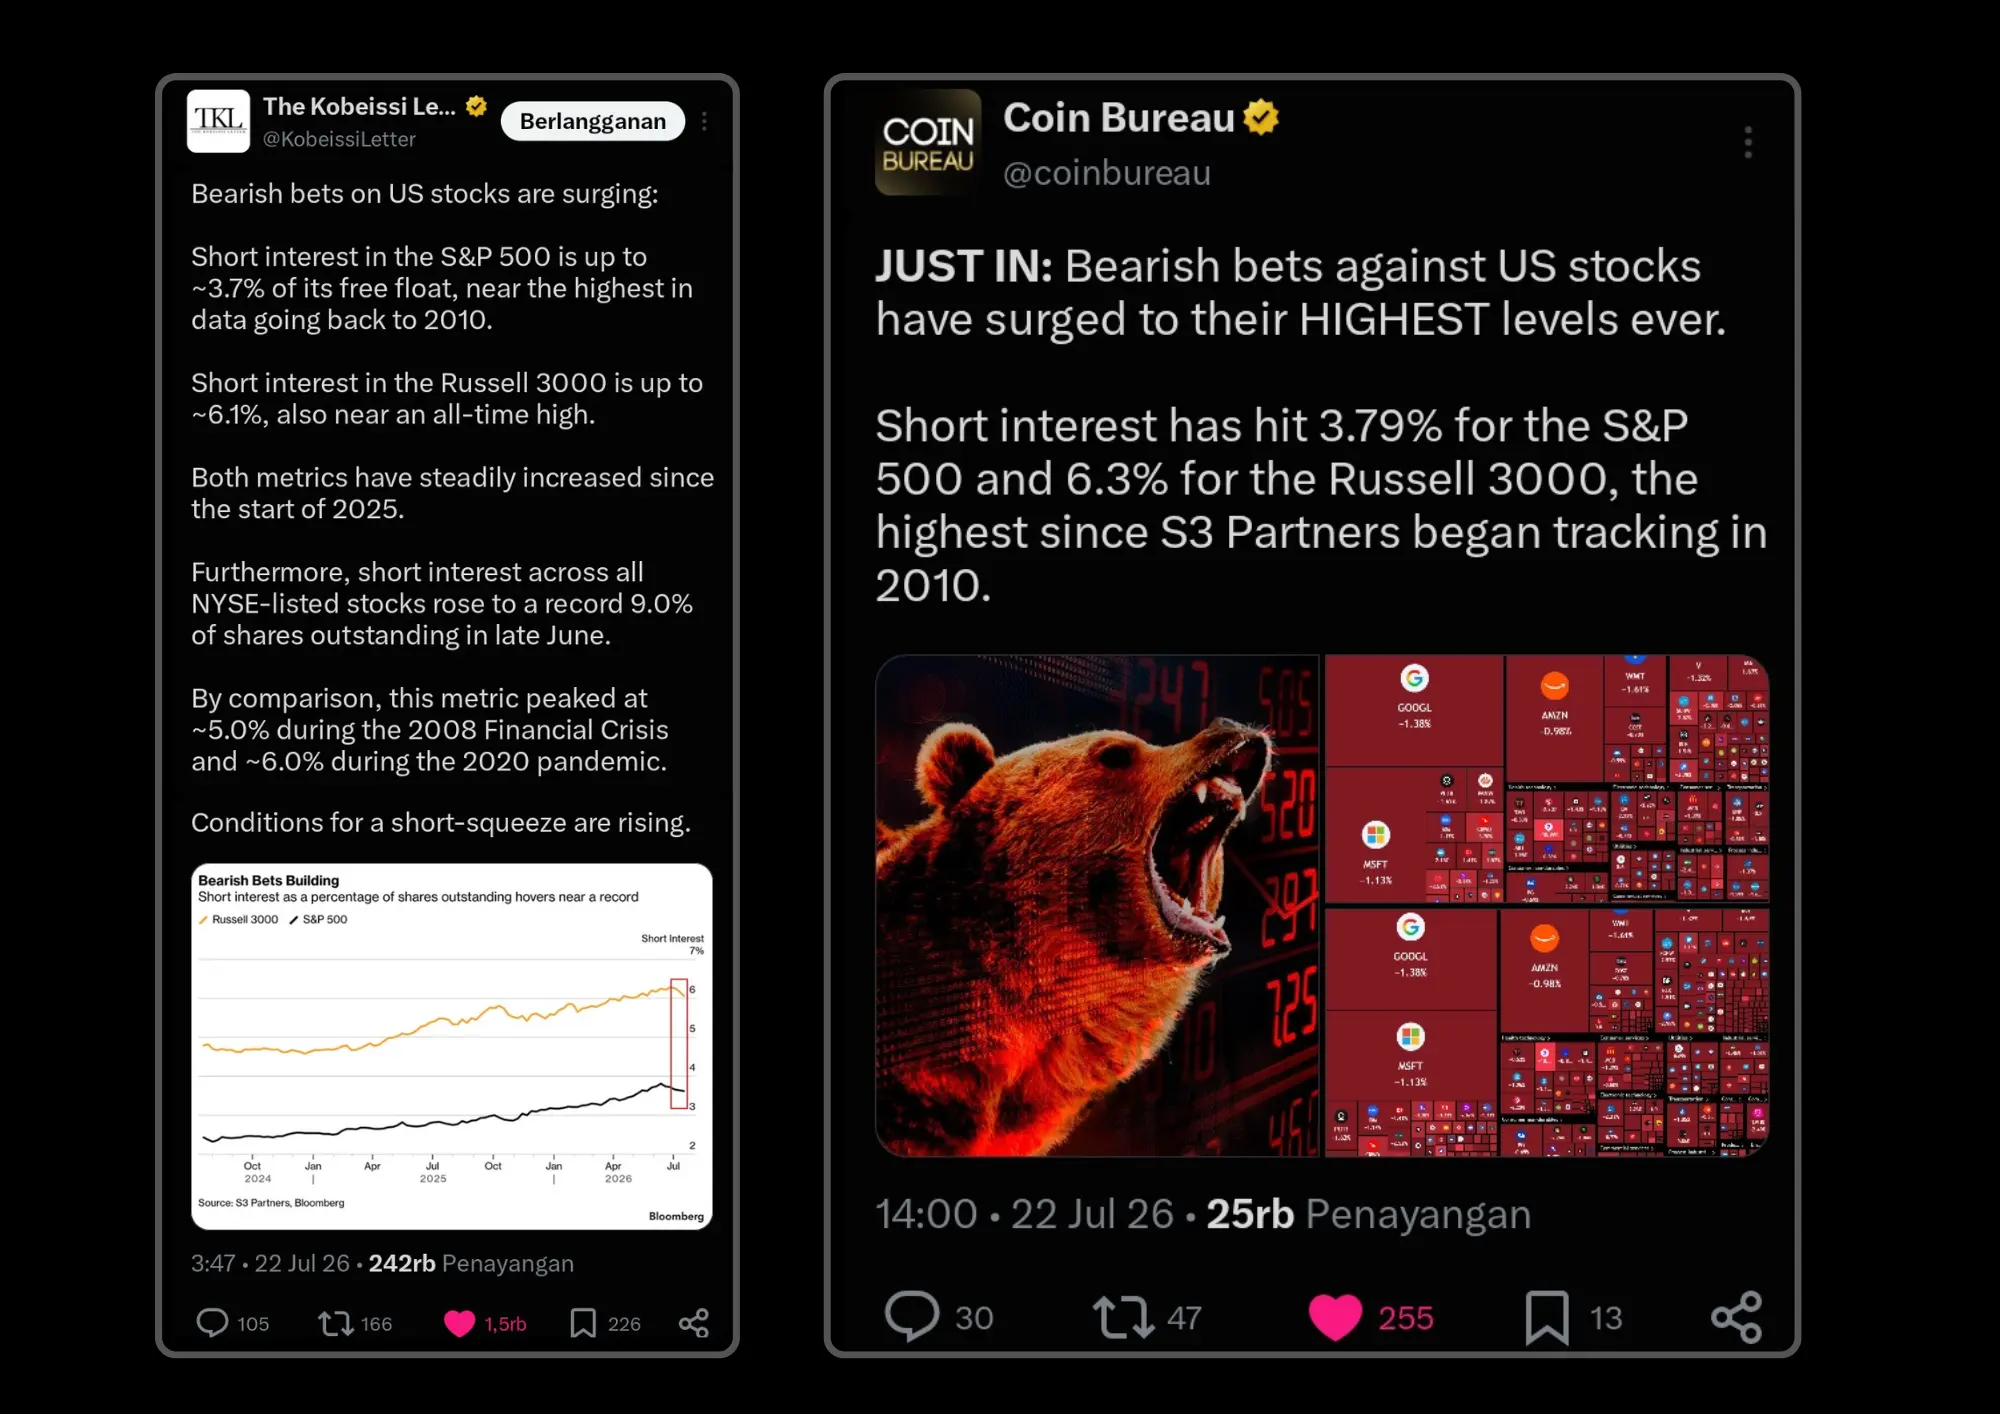
Recent social media posts from sources like the kobeissi Letter and coin bureau highlight that bearish bets against US equities have reached levels not seen since 2010. Short interest on the S&P 500 has climbed to between 3.7% and 3.79% of its available floating shares, while the russell 3000 index reached 6.1% to 6.3%. These percentages exceed the short levels recorded during major economic downturns such as the 2008 financial crisis and the 2020 pandemic. From a technical point of view, when too many market participants crowd into short trades, the environment becomes prime for a sudden short squeeze.
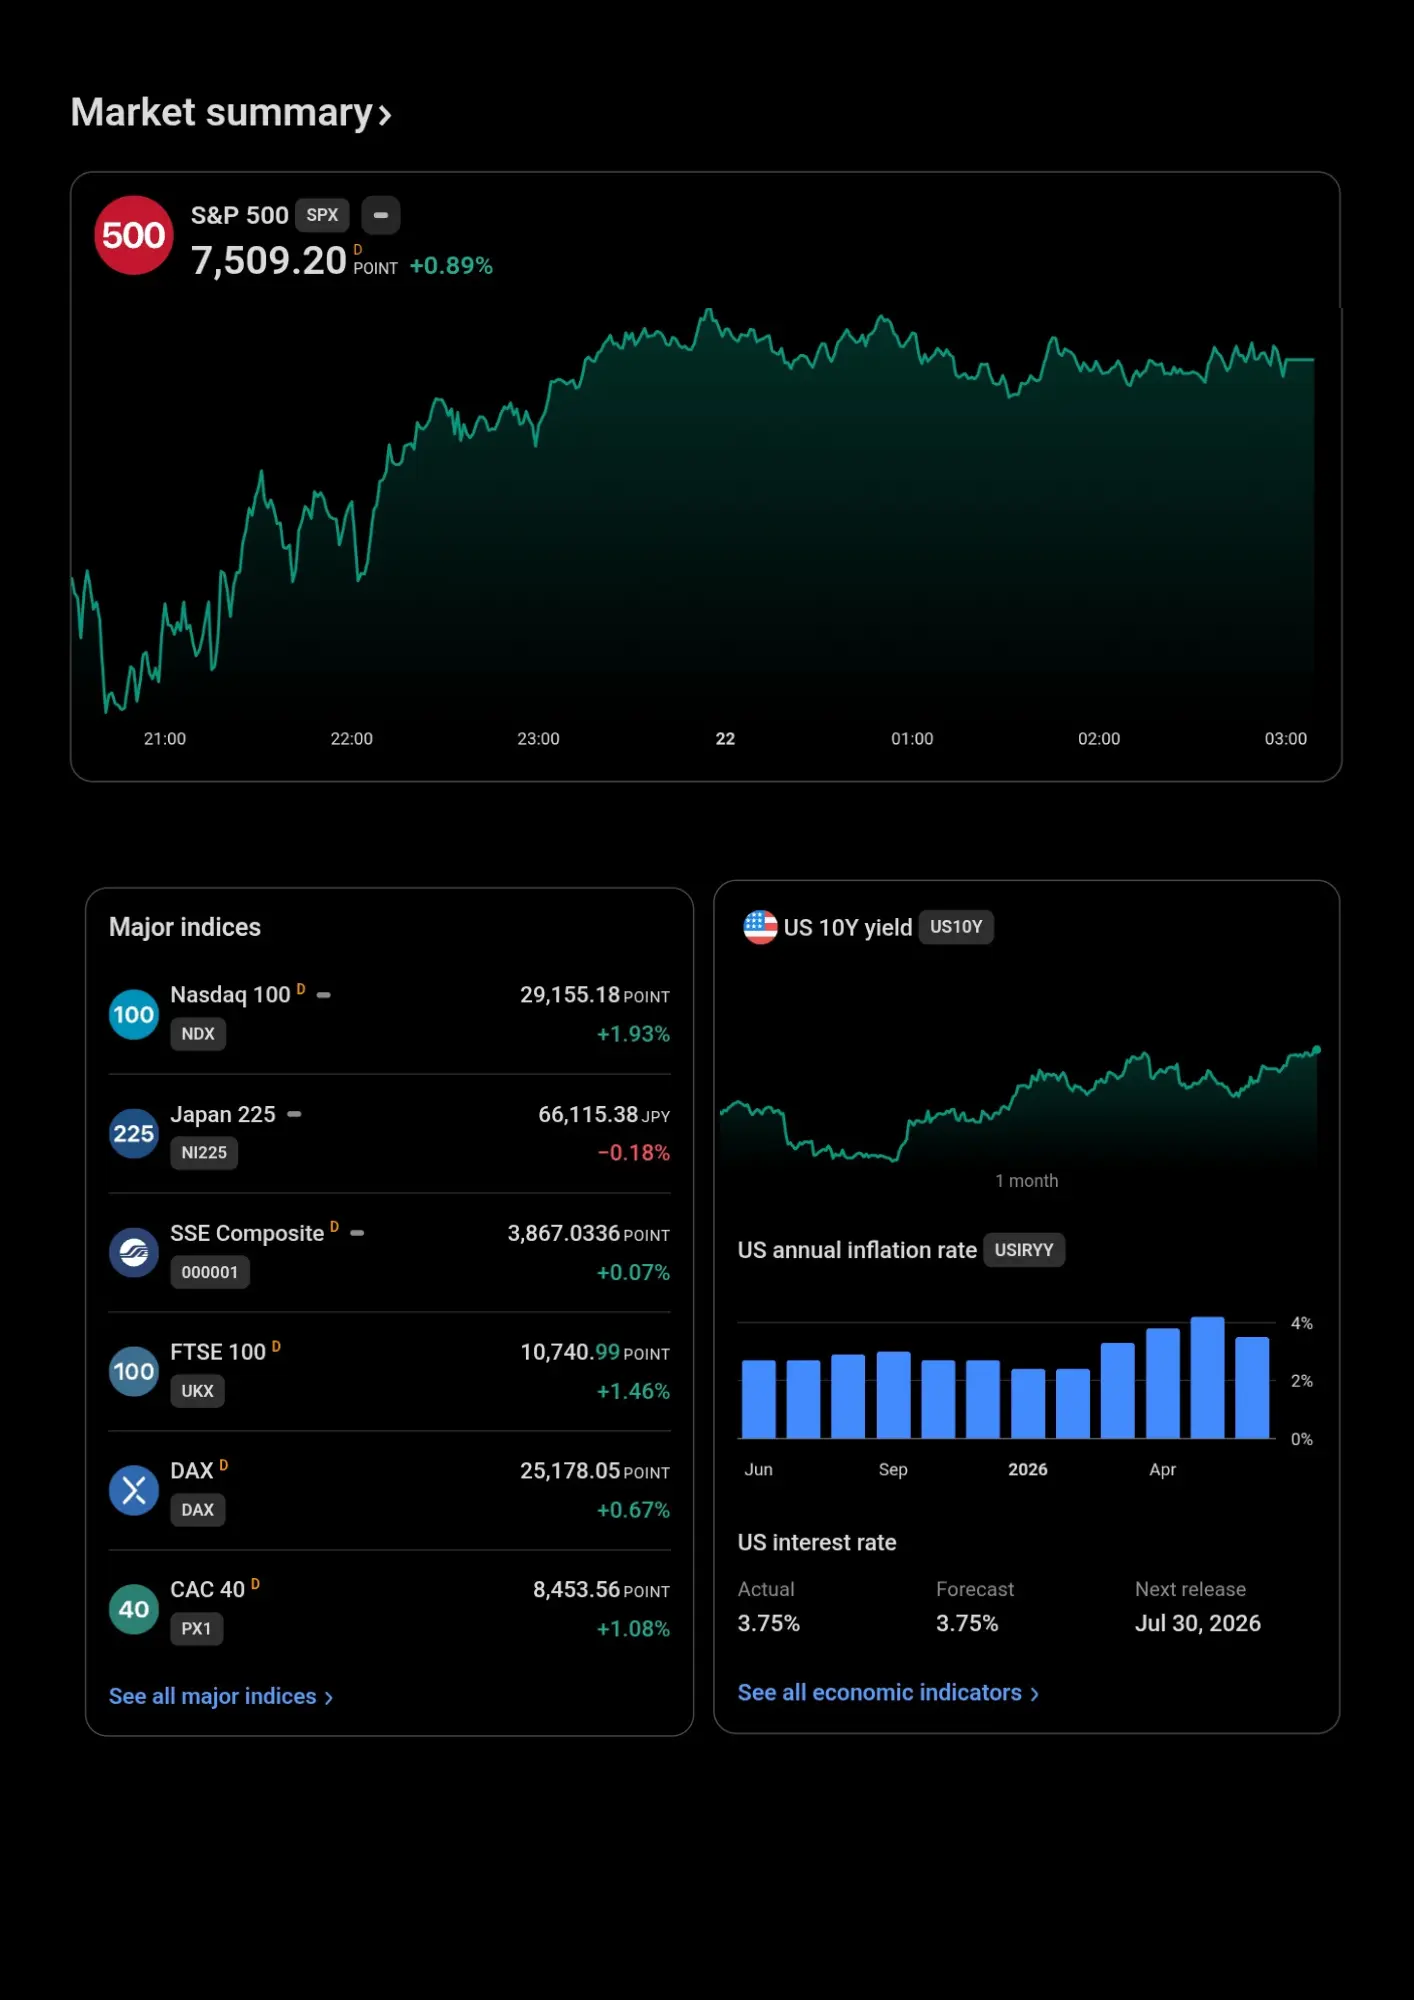
Despite the nervous headlines circulating among traders, broad market data continues to show surprising resilience. The S&P 500 traded at 7,509.20 with a daily gain of 0.89%, while the tech heavy Nasdaq 100 gained 1.93% to hit 29,155.18. Other major international benchmarks including the FTSE 100, DAX, and CAC 40 also stayed positive. On the macroeconomic front, US 10 year Treasury yields showed calm behavior, inflation numbers remained within the 3% to 4% range, and benchmark fed interest rates held expected targets at 3.75%.
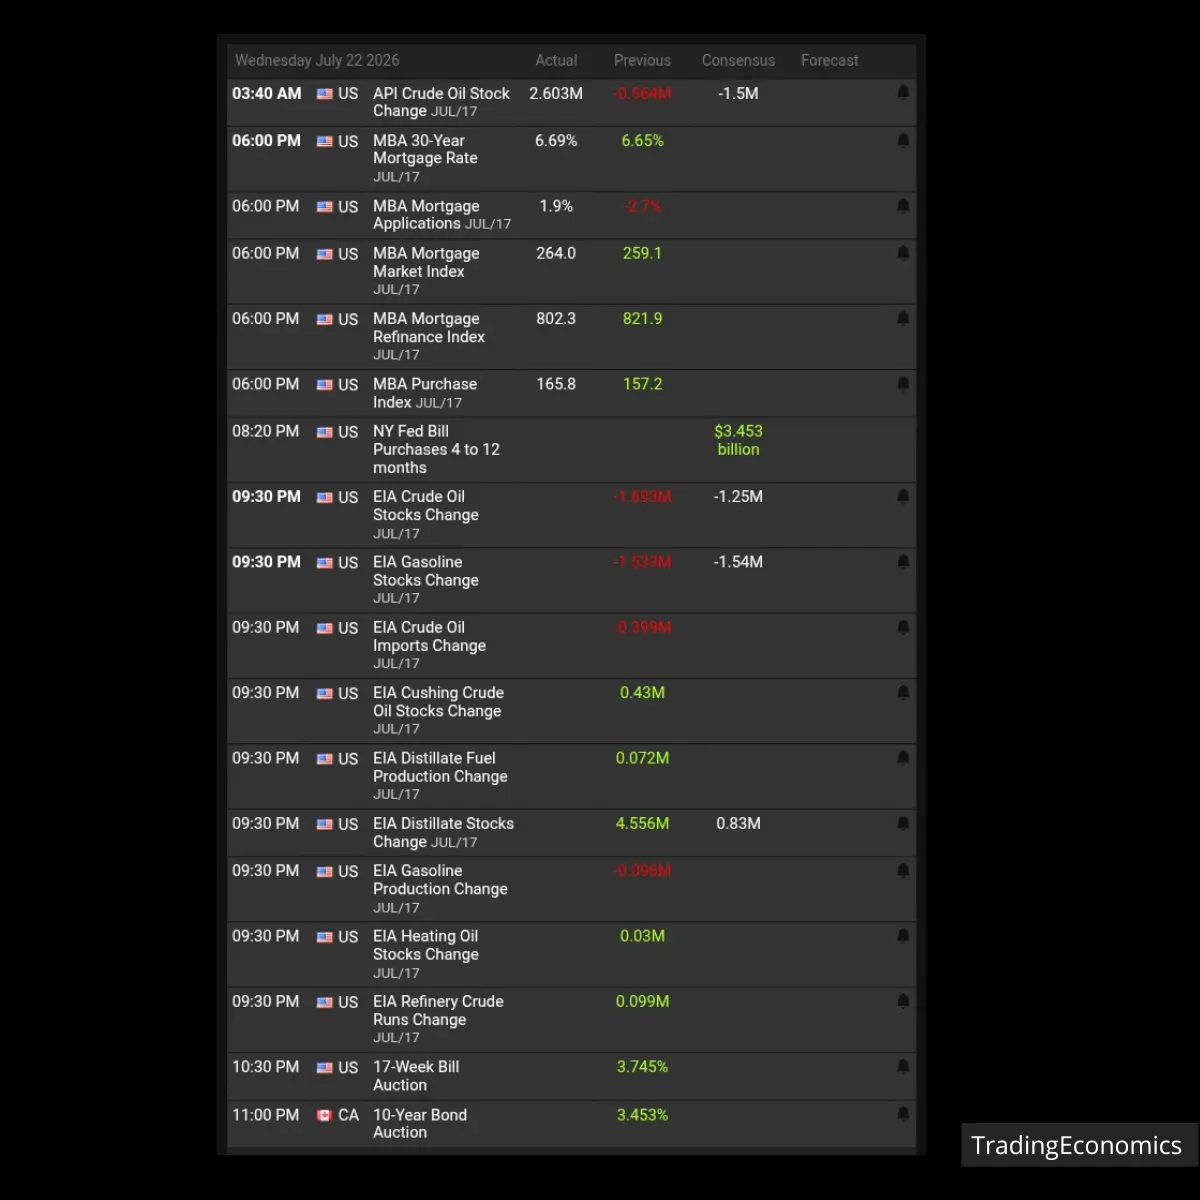
Looking over economic indicators from tradingeconomics, data points like MBA mortgage applications, EIA crude oil inventories, and recent treasury bill auctions indicate a steady flow of market liquidity and stable energy conditions without signs of immediate macro disruption.
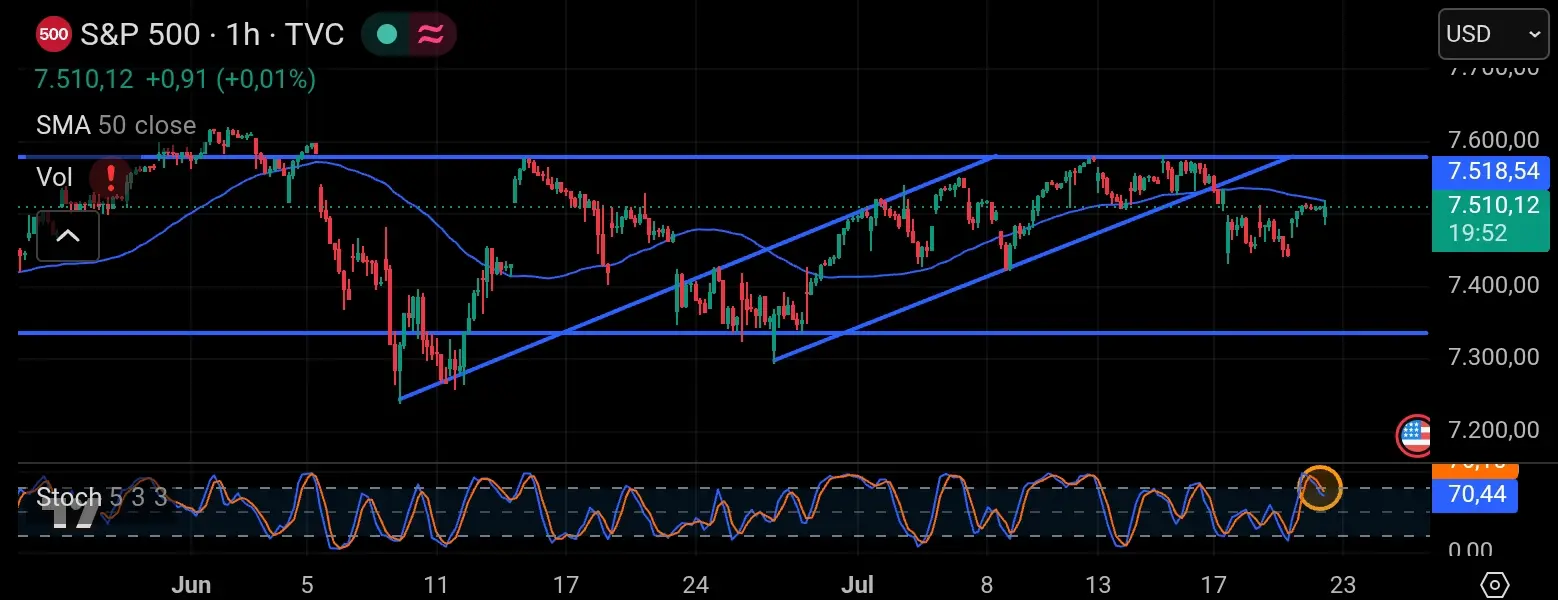
On the 1 hour chart, the technical picture shows the S&P 500 continuing to respect an upward sloping channel. The index is holding above its 50 period simple moving average with immediate resistance near 7,518.54 and solid support sitting at 7,300.00. The stochastic RSI indicator reads around 70.44, pointing toward active short term buying momentum as price tests upper price levels
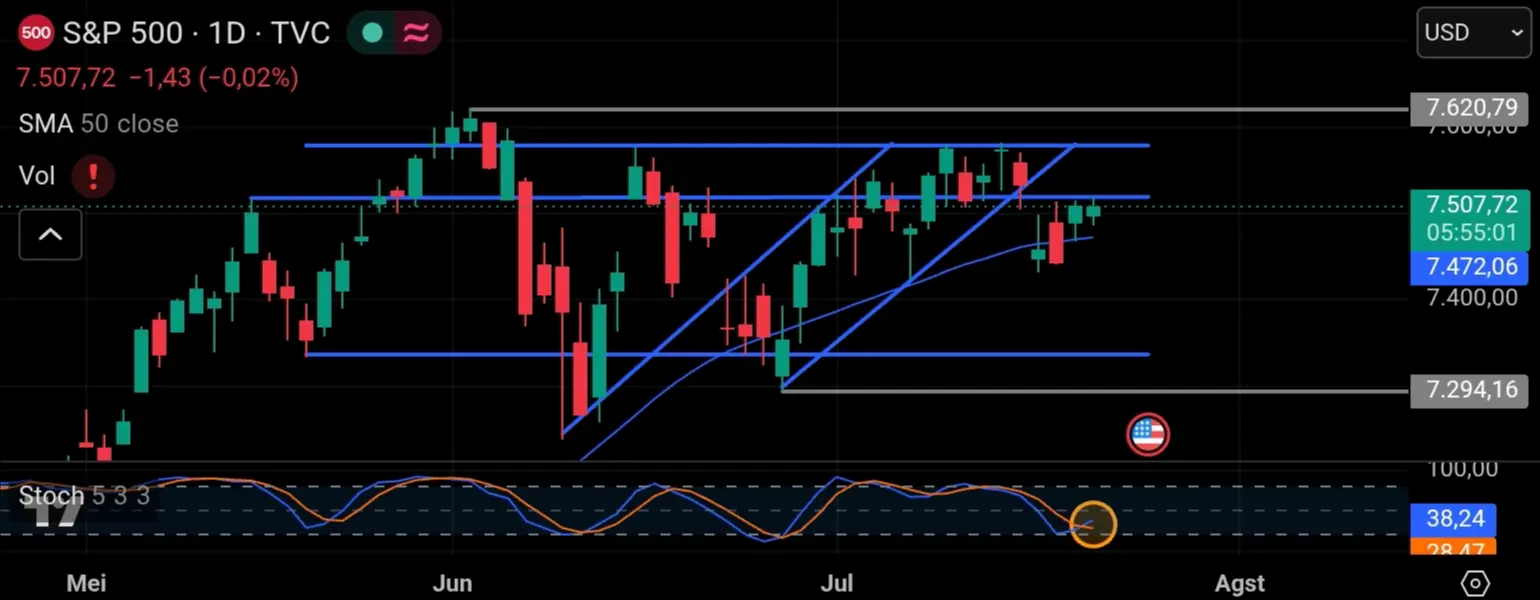
Shifting to the daily timeframe, the overall trend reflects a healthy consolidation phase between the key support floor at 7,294.16 and the recent high at 7,620.79. The daily stochastic RSI indicator recently bounced off the oversold region around 38.24, suggesting that the market still has plenty of room to push upward or continue moving sideways near the top.
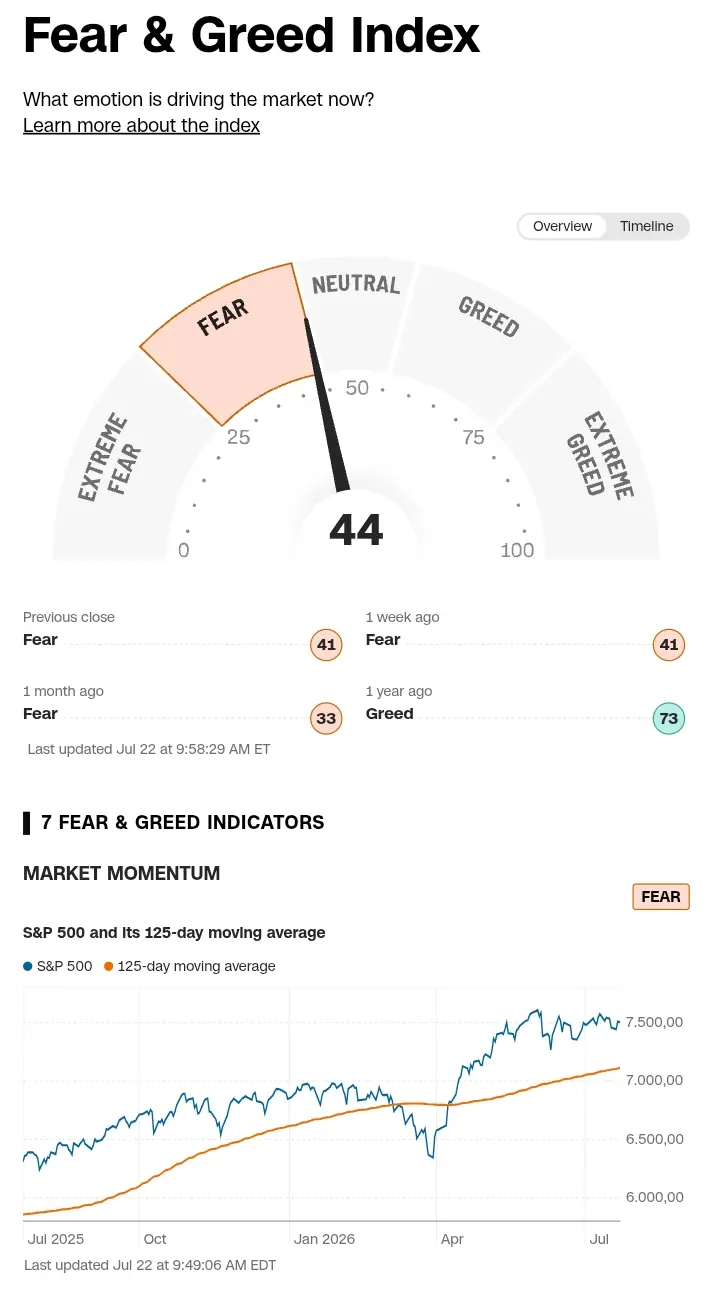
Data from the CNN fear & greed index currently marks a score of 44, which places overall investor emotion in the fear zone. While this sentiment shows caution compared to the extreme Greed seen last year, the S&P 500 continues to trade well above its long term 125 day moving average, confirming that the primary bull trend remains intact.
My Opinion
I believe the risk of an actual bear market starting right now is minimal because high short volume accumulating during a period of market fear usually creates fuel for a short squeeze instead of a deeper collapse. Looking at the chart structure, the S&P 500 is holding comfortably above key support at 7,294 and its 50 SMA, proving that current price action is just routine consolidation rather than a trend reversal. As traders, our best approach is to ignore sensational headlines, stay patient for clean trade setups near support zones, and manage downside risk strictly.
Click here to read my authentic and original analysis
Source
⛔ Disclaimer: This article is strictly for informational and educational purposes only. It does not constitute financial advice, and no trading signals are provided.
Financial market trading including crypto, forex, and stocks involves high risks. While there is a potential to achieve substantial profits, there is an equal or even greater risk of experiencing severe losses, including the loss of your capital. Past market performance does not guarantee future results.
All investment decisions are your sole responsibility. Please ensure you conduct your own research (DYOR) before making any trades.
Keep trading and stay profitable📊





