
Img Source
XLM has a market cap of 3.273B which is enlisted the 12 coin in the top 100! For more details on XLM please check my previous post where I cover all the details on it!
XLM had a bullish run just after BTC reached it's all time high, but after that it had some rough times just as we can see in the charts below.
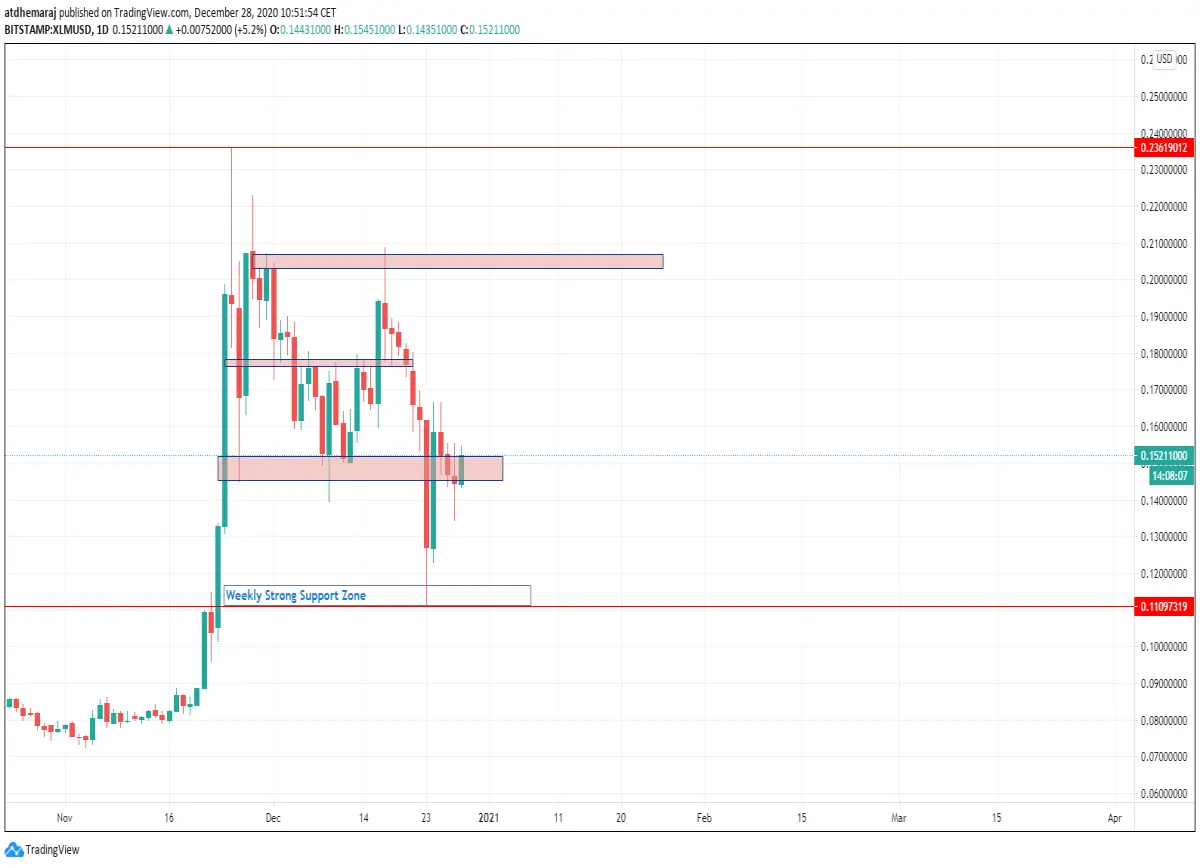
After the bullish pennant we all expected that XLM will shoot up like a rocket. What actually happen is that it was strongly rejected on the 0.206 area! I expected it to find support on the daily support zone which is quite a strong support but we dropped further down to the weekly support area at 0.110 area.
Right know on daily, yesterdays daily candle shows an undecisive candle, that means where bulls and bears are at equal forces. Today's candle started with a strong bullish move, but we are still at the 0.151 area which used to be our support and now it is acting as a resistance.
For more details I'll drop down to 4h TF.
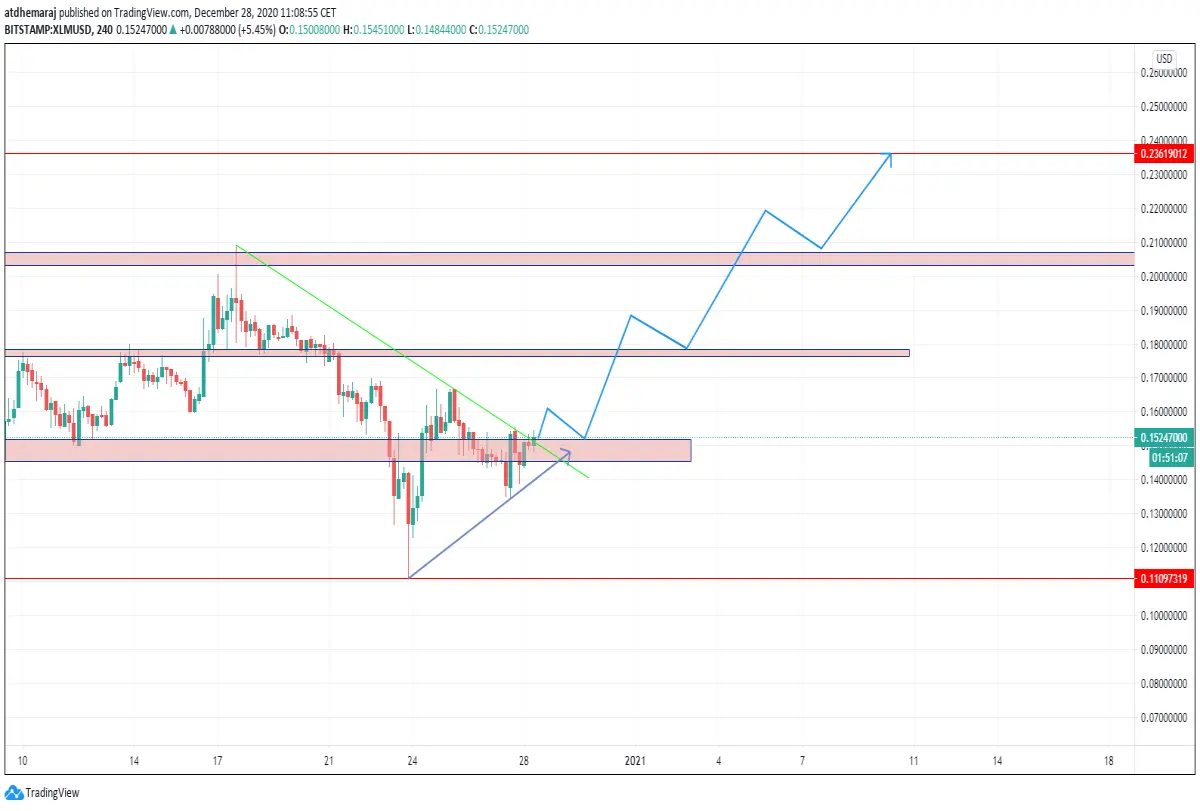
Price didn't break the trend line just yet, and it is inside the resistance zone as mentioned above. What we see on forming it's a Higher Low and a Higher High if the next candles close bullish and above the 0.152 area.
If price breaks above, I'll expect a bullish push after retest which will move higher and react on the 0.178, which has been a quite significant area for XLM.
If price fails to go any higher as illustrated above, then I'll expect another touch of the weekly support zone at 0.110.
Thus, to have an entry on XLM I suggest to wait for a strong bullish candle on 4hr TF, that will give us confirmation for further bullish move.
Let me know in the comment section if you trade or made any analysis on XLM.
Catch with me on Leofinance!
theatdhe!





