
Biggest struggle for new traders and those who think to put some bucks in a asset or a coin is the question "When is the right time to buy".
Well, out there are a lot of gurus that predict the market, others that have developed computer codes that buy and sell at the right time, some even go to a more crazy ideas...you get the picture!
So, when is it the right time?
I'm no guru first things first. I love things that make sense, facts, puzzles and other stuff that put your brain into work. Learning to read the price action is like learning how to swim. Predictions are just predictions, they don't have any scientific proof, in less words it is just chit-chatting.
By knowing how to read price action you will understand how the price is moving and where it is headed.
Even if you see and know that price is i.e going lower how do you know when it will stop and shift directions?
That is actually another problem itself. Why? Because you should have basic knowledge on drawing and identifying zones and here you should be able to identify major zones from the minor ones.
For this you'll need price action history and some of the coins are so new that the history is super irrelevant.
Anyhow, in the coming days I'll be posting my technical analyses on some of the major cryptos, I'll be open if you'd want me to cover any other coin...let me know down on the comments.
Moving forward to the XLM analyses!
Most of the cryptos had a bull run in the previous weeks...and that was quite a push. Most of the pairs followed BTCs bull run and some of the small valued coins went up for more than 100% in just a week, XLM was one of them.
While in the chart below we will see that we have a major support zone at 0.1151 area, we already created a what so called bullish pennant in the daily timeframe. 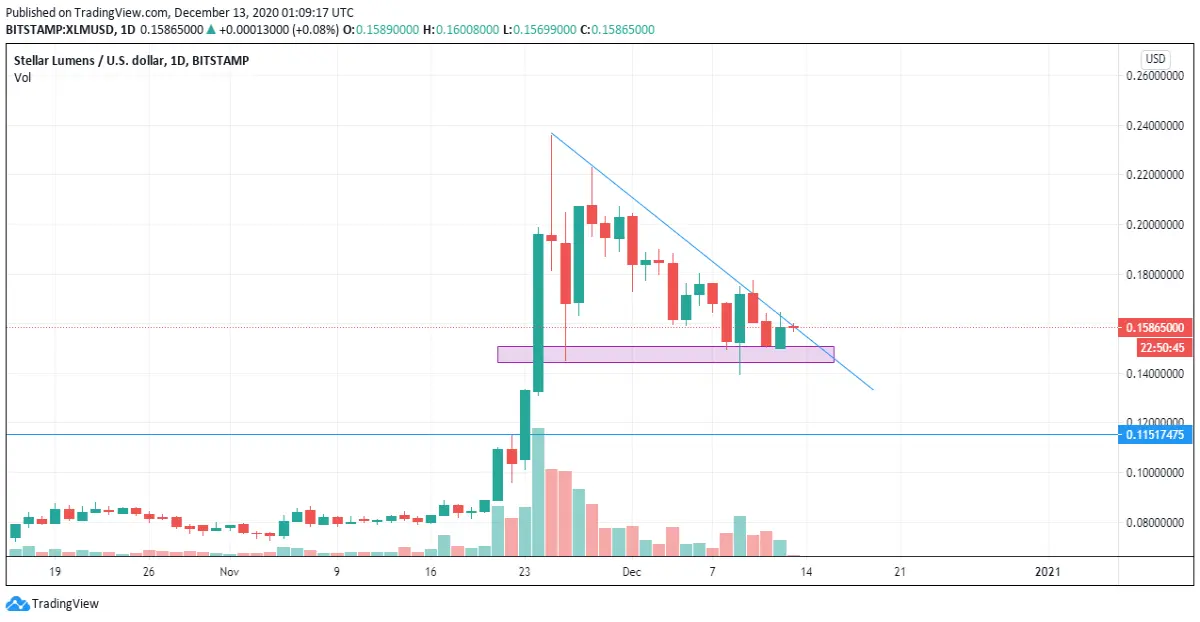
For those who are not familiar with the patterns...let me know if I should cover them up in my next post.
Usually what happens here is that after price finds its support it moves straight with another impulsive in that direction (whether is bullish or bearish). Here we see that price has formed a beautiful pattern and next what we have to do is drop to smaller timeframes and see for the support and entry point. Usually this is the most tricky part.
Price, at the moment seems like it found its support at the 0.150 area. So what's next? Is it this the moment of truth?
Well, lets drop to 4hr Timeframe.
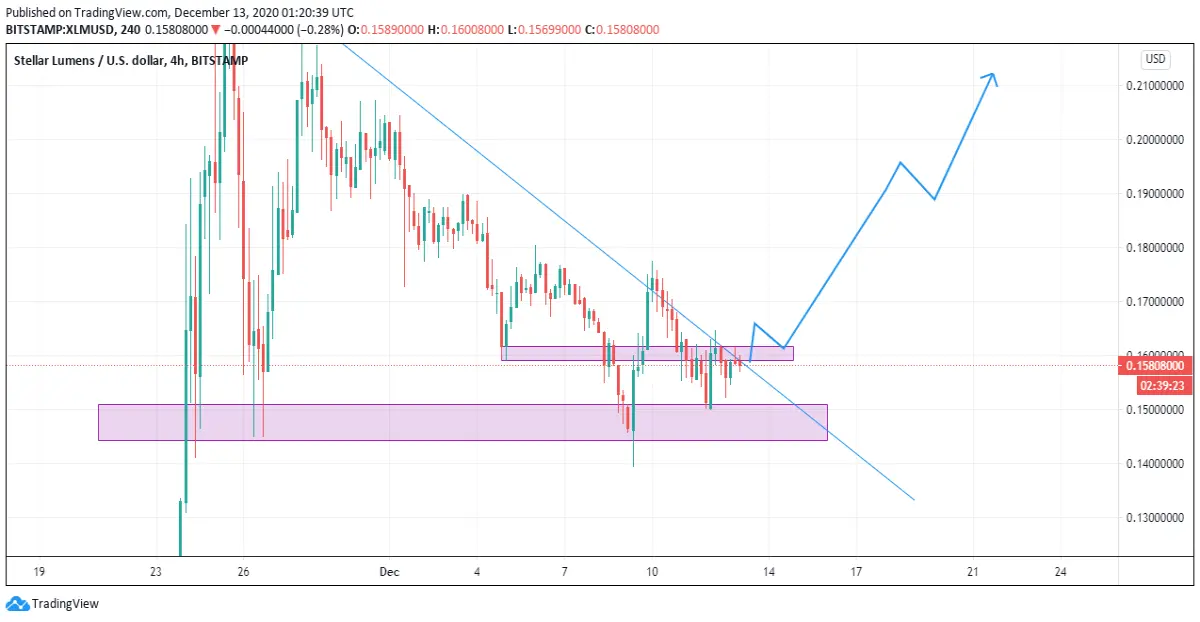
As I did mention above we got to see where price is headed. Even though price is consolidation inside the range of 0.15-0.16, we need to break and retest above 0.162 area and create a HH (higher high) to actually confirm our buy. Price wont be moving in a straight direction. As we should know that price doesn't move just up and down...it moves in 3 directions:
- Upwards
- Downwards
- Sideways
So, is this it?
Sadly, not really! As traders you should always make sure you have the other case scenario. Price could break this newly created support area and move to the major one down at 0.115 area.
What if it breaks down?
Well, if it does so, you wait for the retest on the 0.145 area and place your selling orders, hold you sells till 0.115 and collect your profits.
Even better if you buy me a beer after that! After it goes there and I get my beverage, I'll tell you my analyses on when to buy and hold the long run.
Let me know if you liked this post! What are your thoughts on XLM and what do you want me to analyze in the next post.
See y'all in the next one!





